The Day I Couldn’t Run Anymore: A speed-bump on a long journey

“Though the road’s been rocky it sure feels good to me” – Robert “Bob” Nesta Marley, Jamaican musician, poet and philosopher.

cover

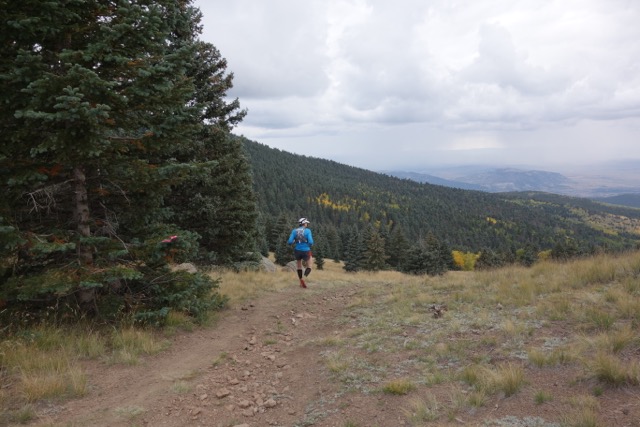
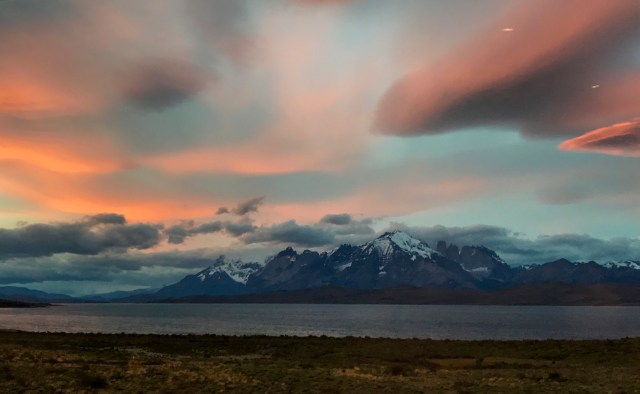
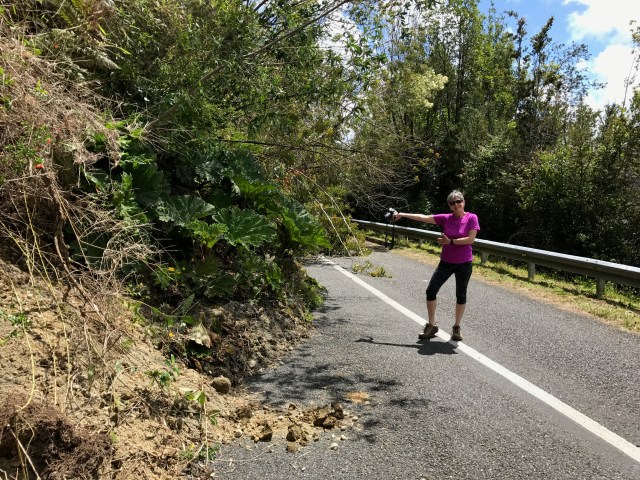
Running downhill at the end of the Mt Taylor Ultra.  Running in the mountains is a special kind of freedom.  It is not the running, nor just the mountains, but the marriage of the two. The bow legged stride I exhibited in this run is a sure sign of knee damage.

In the fall of 1971 I decided I would run to high school from my home three days a week.  The decision was driven not by any love of running, but rather my desire to get into outstanding shape and prepare me to make the cut for the JV basketball team at Los Alamos High School.  In those days, I lived about 10 miles from school and the run had a gain in elevation of about 1000’; the run was along a road with a wide shoulder, and I could leave in the dark and make up “the hill” before school started.  This well thought out plan to overcome my lack of athletic ability (and complete inability to jump even a few inches off the ground) by having superhuman endurance crashed back into the boneyard of reality after about 3 weeks.  My knees became inflamed, and I hobbled around the basketball court under the disapproving gaze of the coaches that wondered why I did not just stick to the chess club (which I was a member of, by the way).  My mother took me to the family physician, who in turn, sent me to a specialist.  I was diagnosed with Osgood–Schlatter disease (OSD) – inflammation of patellar ligament just below the knee cap.  OSD is relatively common in adolescents, especially boys, who are undergoing growth spurts.  The pain was intense in the quiet dark hours of the middle of the night, and I became well acquainted with ice packs and the bright red color of skin that feels frozen from the cold.  50 years ago, the treatment regime was “rest” and waiting out the growth spurt.  Eventually I could run again, although I never quite gained the super endurance that would allow me to overcome my lack of coordination.

Today it is known that people that have suffered through OSD are much more likely to develop arthritis, or inflammation of the leg joints – knees and hips – in later life. Arthritis is really a description of symptoms, and there are dozens of “types” of arthritis.  I am cursed with osteoarthritis, which causes the cartilage to breakdown over time. For a lucky few (including me), the breakdown of cartilage is accompanied by the growth of bone spurs, especially on sides and beneath the knee cap. These tiny osteophytes are like small thorns on a rose bush – rub them in the wrong way and they cause pain. Realistically, my osteoarthritis is likely the result of heredity. However, I loved playing basketball, and to a lesser extent football, and this combination of osteoarthritis and sports that impacts joints conspired to make me a punch card for surgeries: I have had enough that surely I qualify for a TV advertisement for Stryker, one of the world’s larger manufactures of prosthetics.

kneesalike

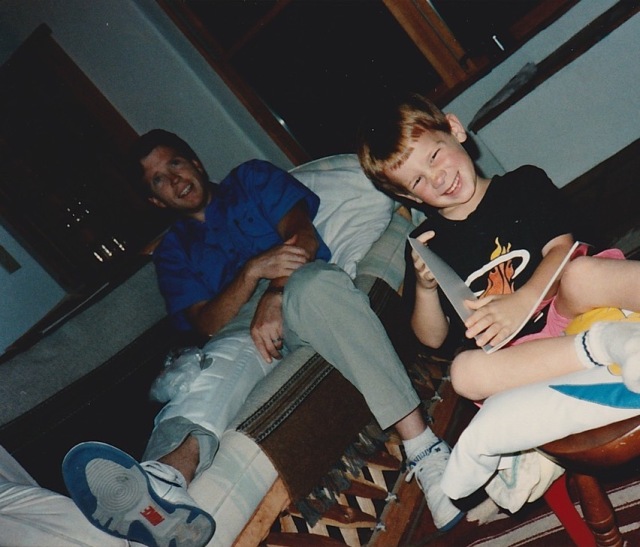
A fews days post surgery in 1989. My son has sympathetic knee pain, and is propping his knee up to relieve the misery.  2nd knee surgery, and the cartilage was 60 percent gone.

On April 25, 2017 I became a full bionic man – well as far as my legs are concerned.  But the journey to having more metal in my body than is present in most modern automobile bodies began in 1976 I when I was playing in a basketball game. My left knee got twisted and I had my first surgery to remove a tear in the cartilage.  I recovered; in 1989 I repeated the experience, but on my right knee. I went into surgery to remove the tear, but once the surgeon looked at the knee he discovered that lack of cartilage had caused scoring of the bone, and decided to refinish, or smooth the bone.  That was a crummy experience, and caused me to have to delay my honeymoon (which had already been delayed for more than a year due to other reasons) – but I was told on no uncertain terms that I could never run again.  I followed that direction for an entire year, and then I was back to playing basketball 5 to 7 days a week.  But, as an insurance policy I took up bicycle riding in a serious fashion and started riding centuries, my introduction to endurance sports.  It turns out I bought the wrong kind of insurance policy, and I had to have my left hip replaced in 1998 at the tender age of 42.  I never played basketball again.

kneesurgery

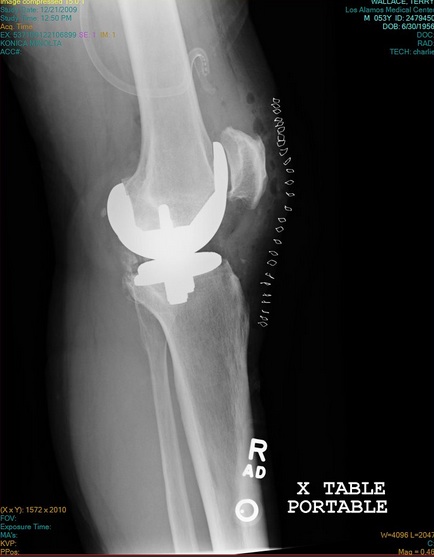
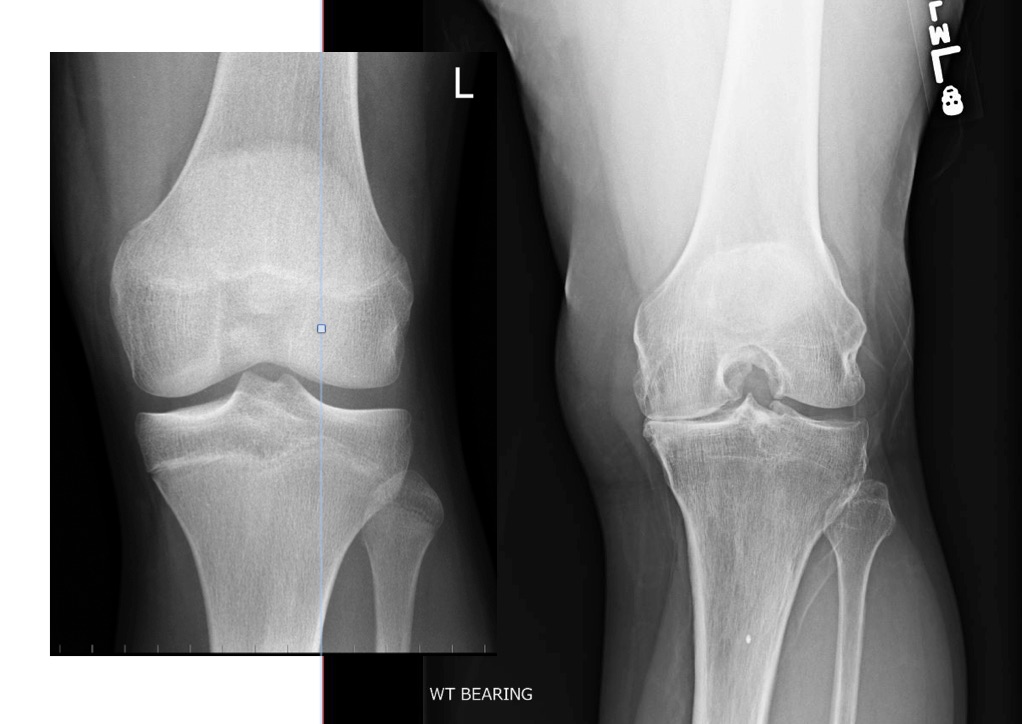
X-Ray of my right knee, after my 2009 replacement. The grinding joint is replaced with a smooth surface.  The knee cap has be reshaped and all the bone spurs removed.

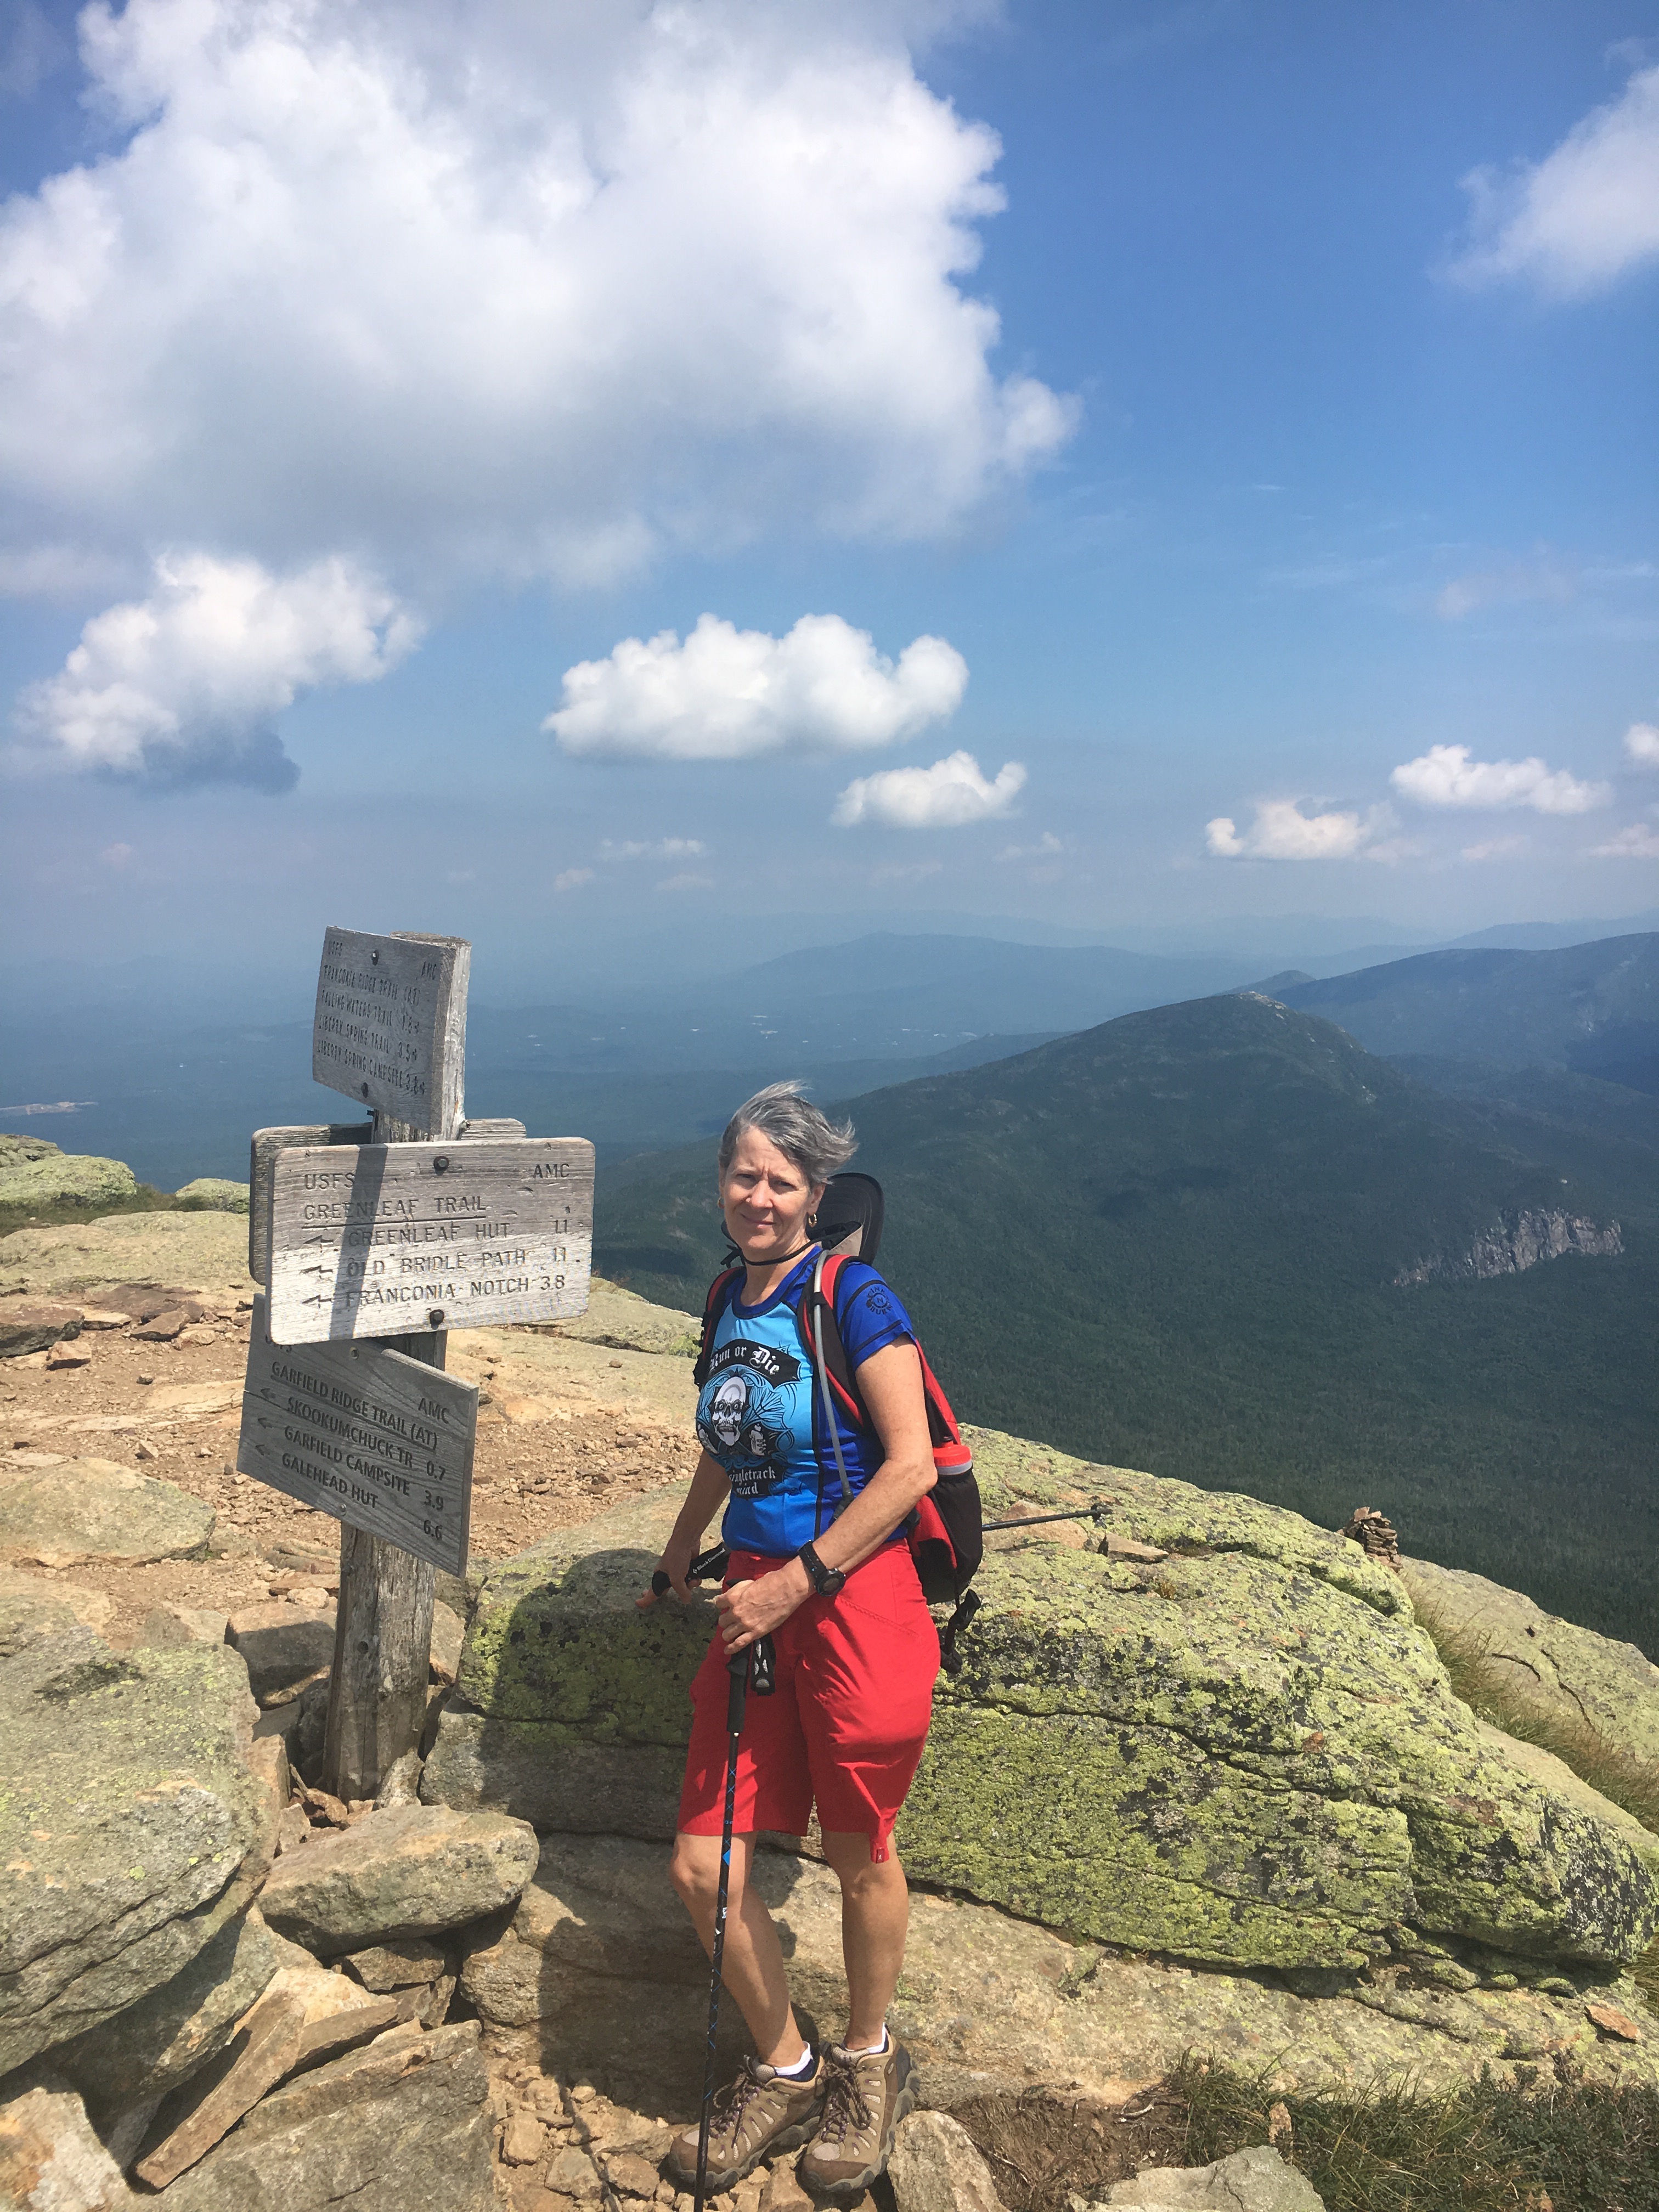
Eventually, even though I no longer played basketball, I had to have my right knee replaced in 2009.  The refinish job I had gotten 20 years earlier had extended the lifetime of my knee remarkably, but bone-on-bone eventually won out.  The recovery from knee replacement was difficult and humbling; but the result was transcendental.  Within a year I was climbing mountains with ease where I had struggled before. Magic.  In 2012, I started to run trails, and found a true joy.  I knew that there was advice not to run again with a prosthetic, but I also understood the research on the wear and failure was very conflicting (I wrote about running with artificial joints: https://wallaceterrycjr.com/2014/04/29/conventional-wisdom-and-scientific-fact-the-dilemma-for-a-trail-runner/ ). Frankly, I was far more concerned about my natural knee, as I knew it was the evil twin of my knee that had alreay been replaced.  In 2013-2015 I ran between 2200 and 2500 miles per year.  Check ups of my artificial joints showed no ill effects – but I knew that my left knee was slowly grinding to pulp. I could see my knee cap “growing”, and I was having trouble bending my knee enough to walk up or down steep stairs.

batcanyon

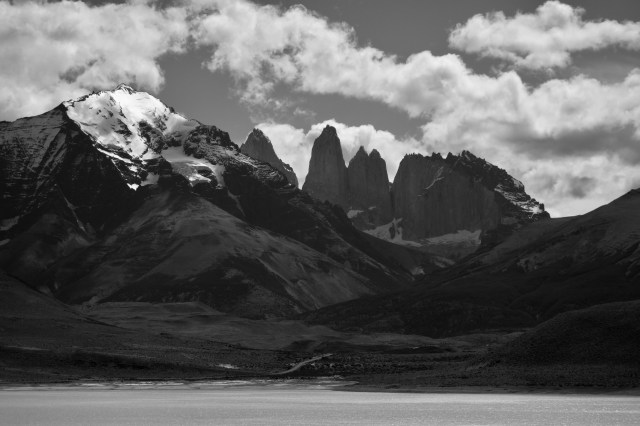
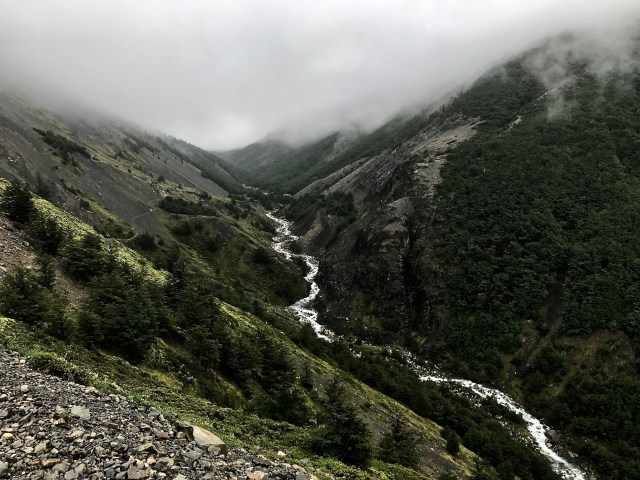
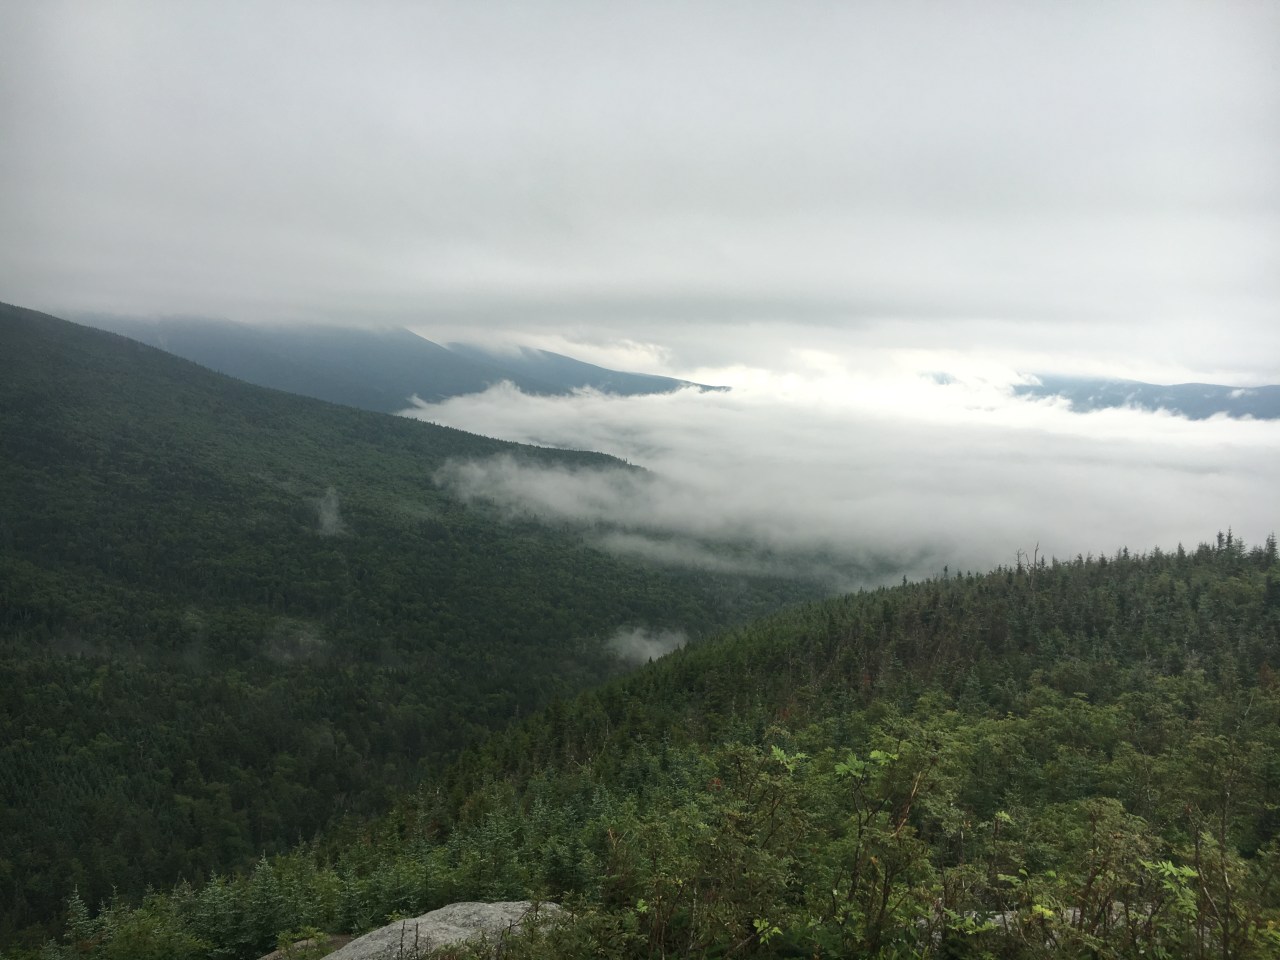
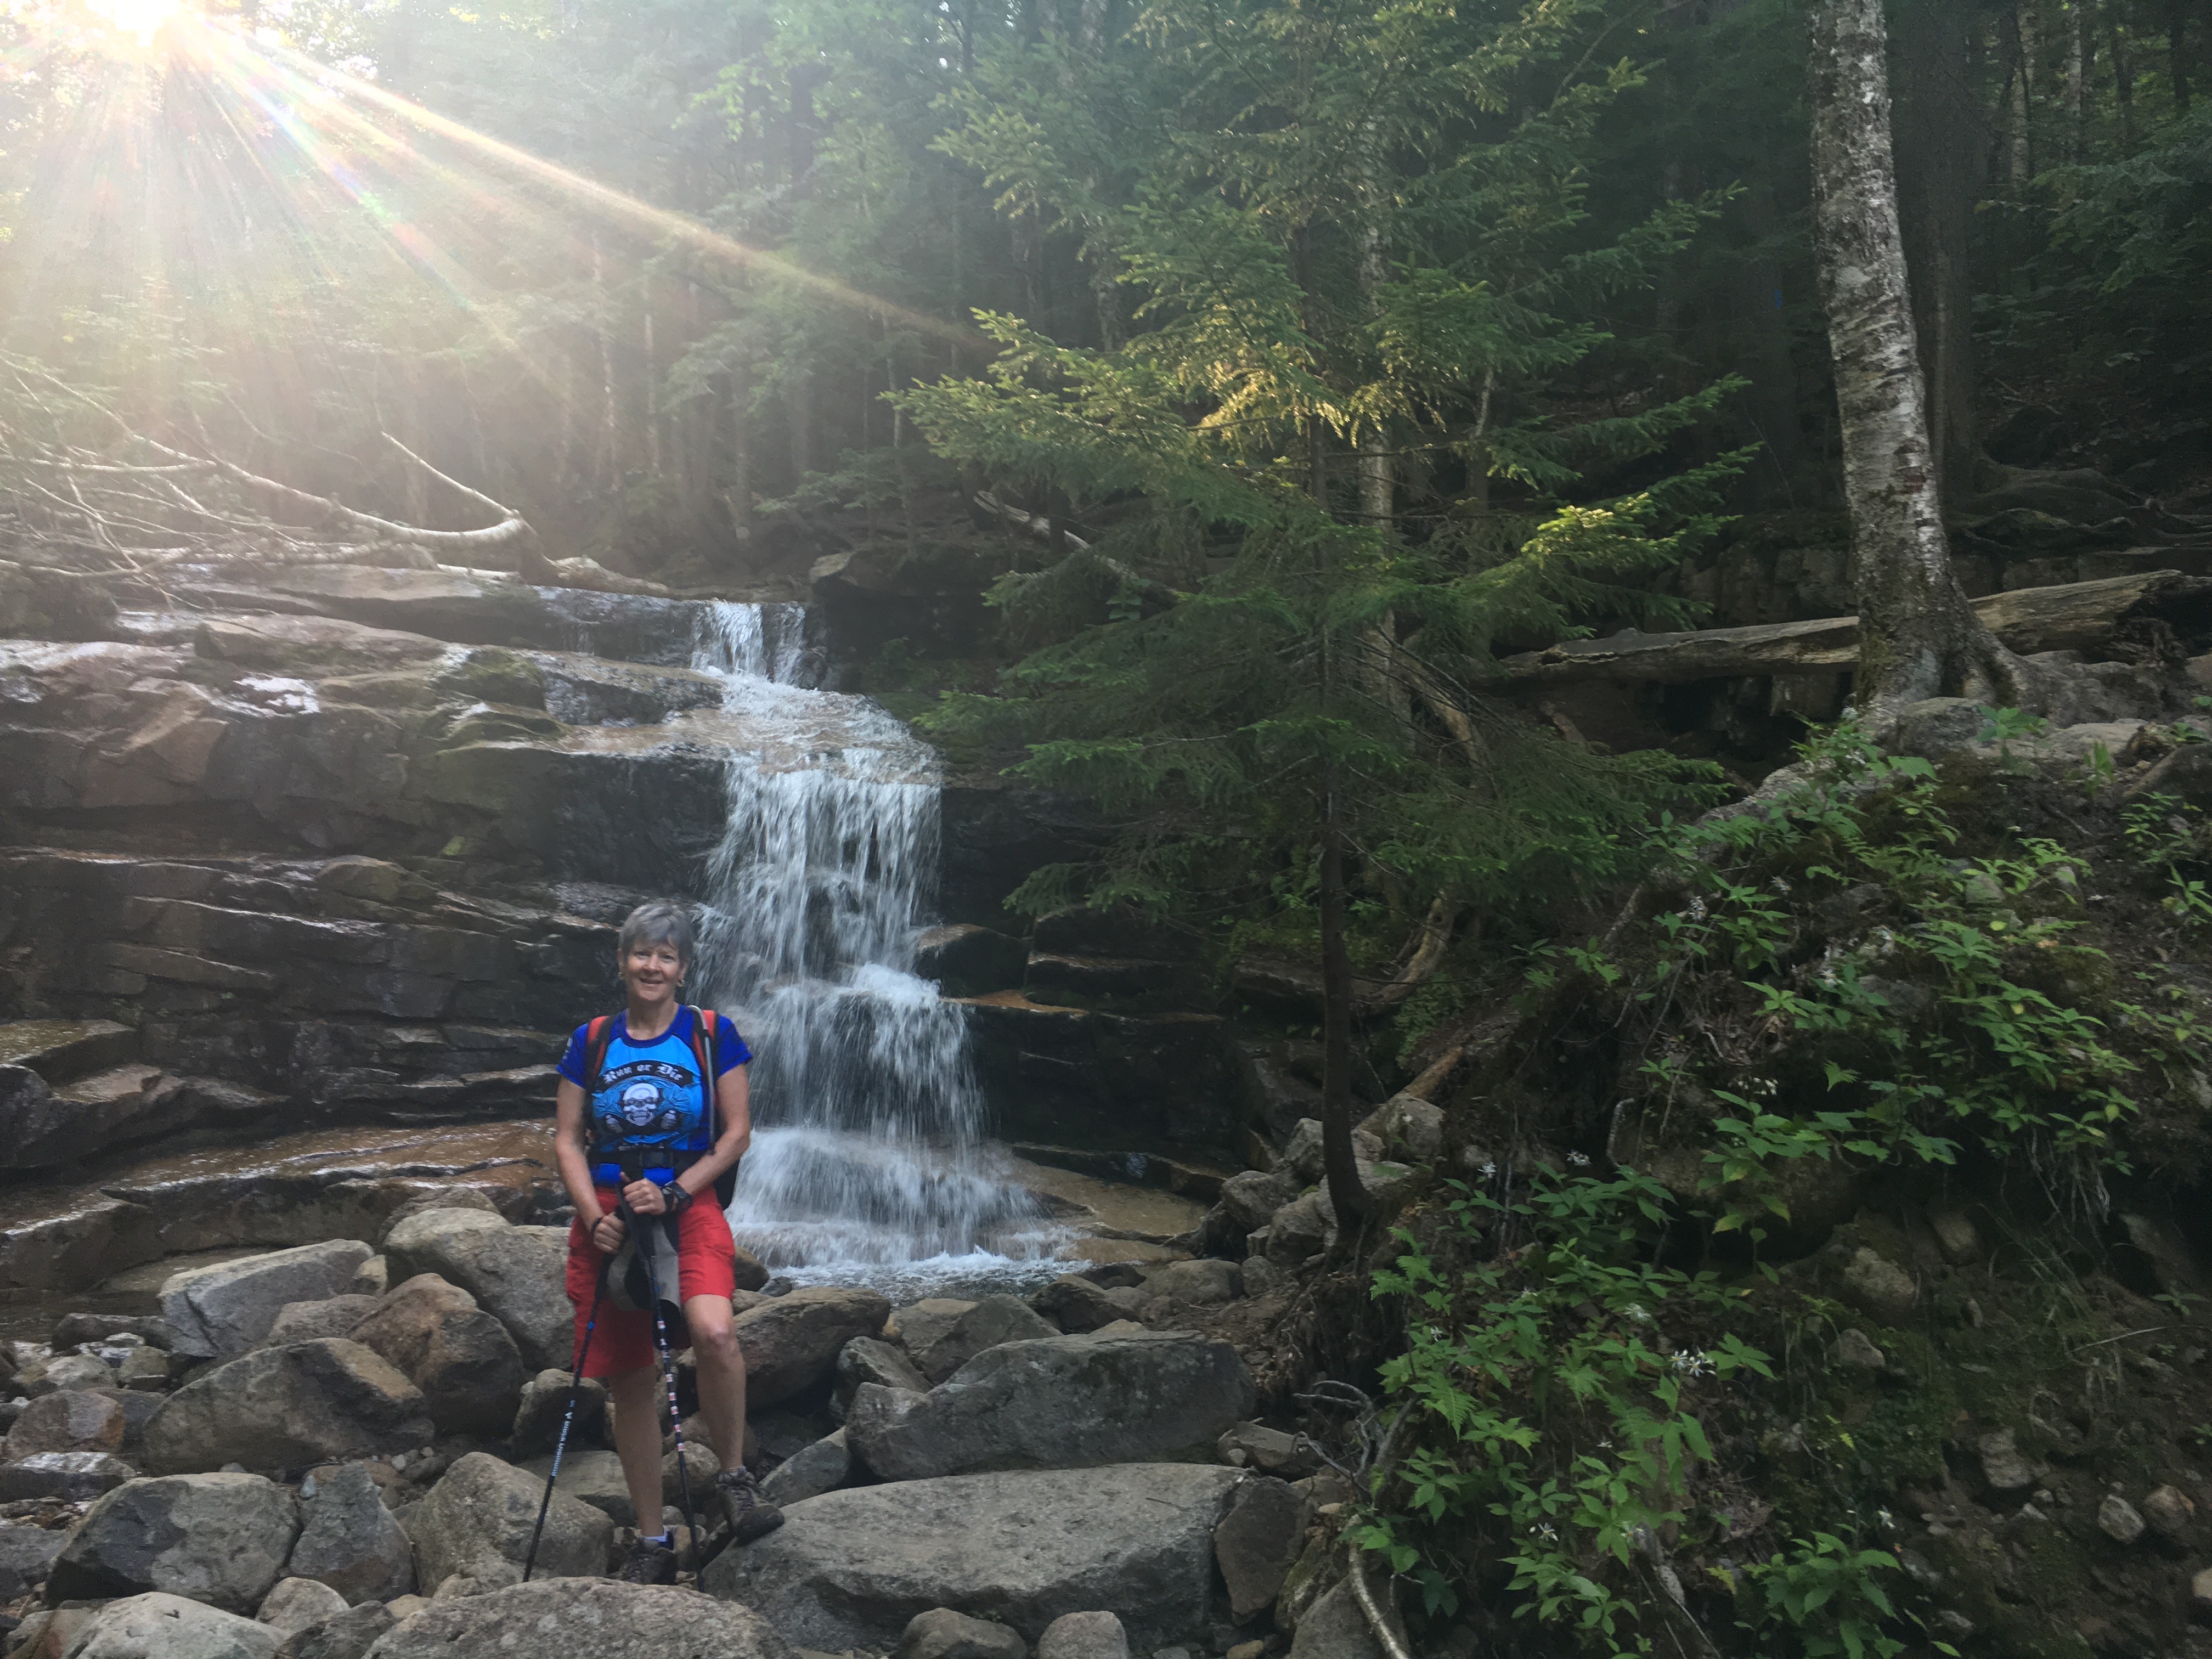
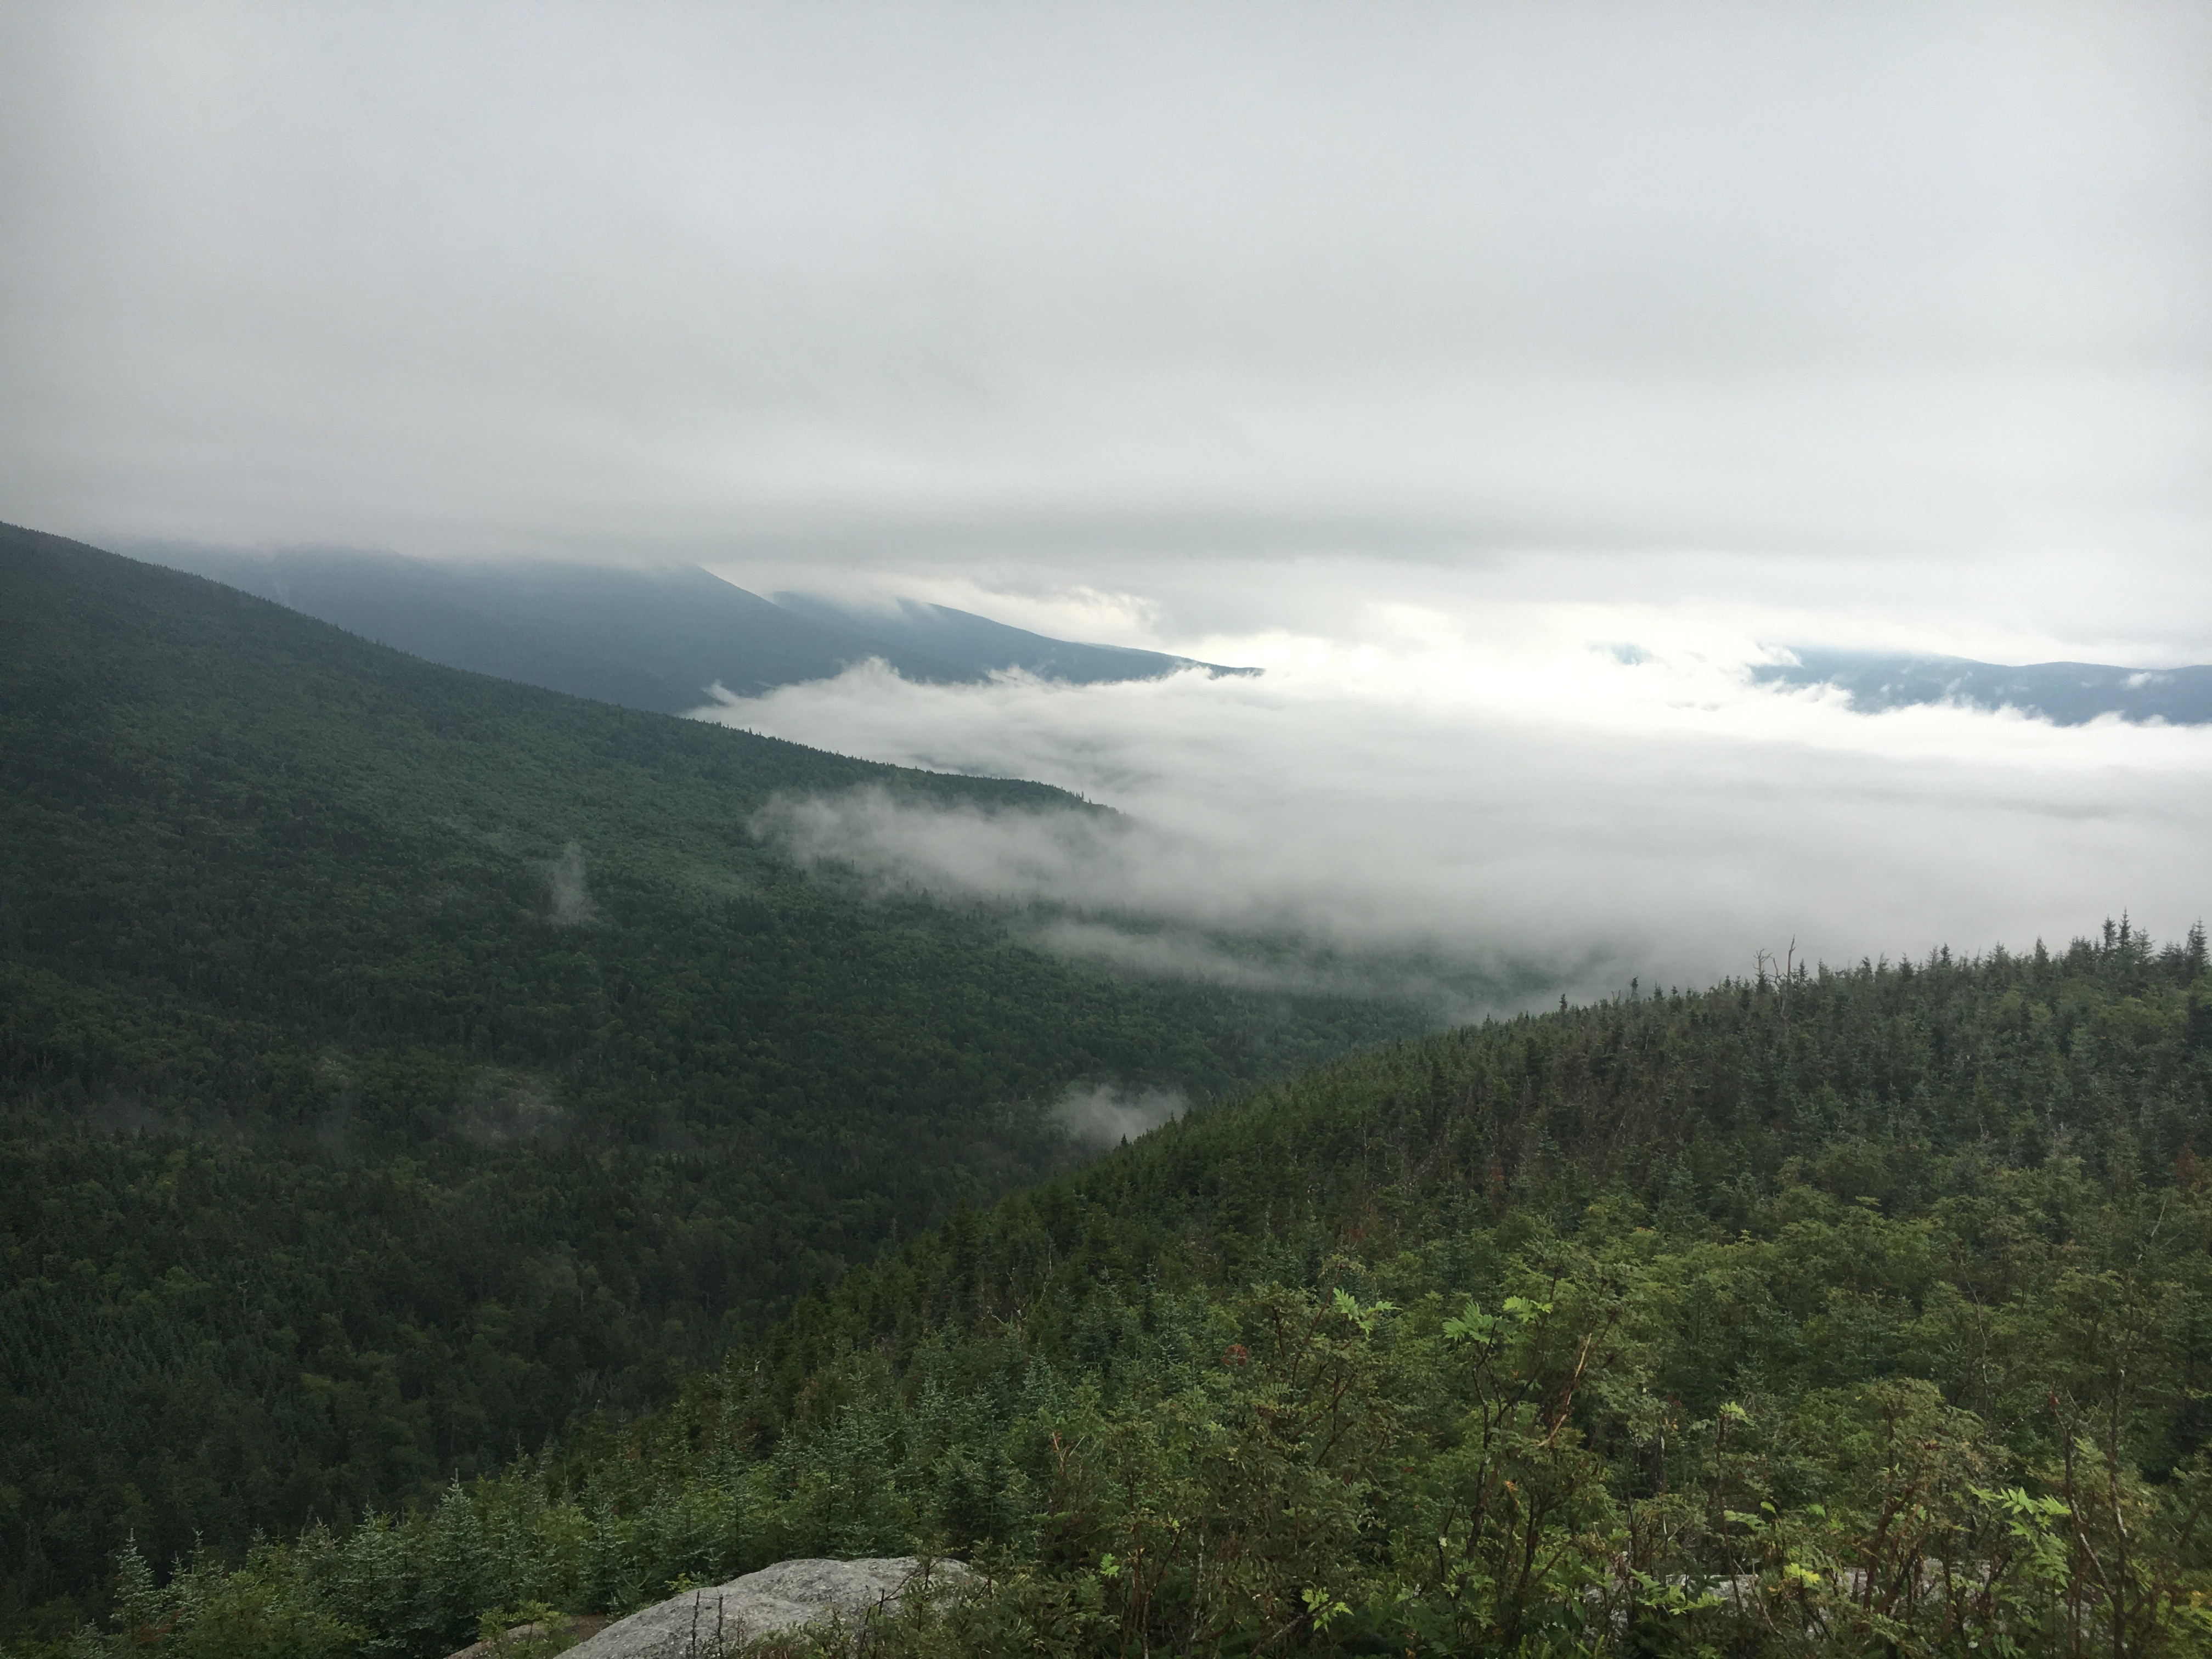
A view down Bat Canyon from the turn around point of the Canyon de Chelly 55 km ultra. the race climbs and then descends about 1000′ over a rocky trail.

A Fateful Run

In October of 2015 I ran a fantastic 55 km ultra through the scared lands of Canyon de Chelly.  The race is a 17 mile out-and-back through a sandy wash; mile 15.5-17 is a steep climb of 1000 feet out of the canyon to the rim (https://wallaceterrycjr.com/2015/10/12/sacred-land-a-run-through-canyon-de-chelly/ ).  After refueling at the turn-around, the course is a dive back into the canyon; steep and rocky.  Within a hundred yards I knew that something was wrong.  My left knee was swollen, and would not bend – so my decent was less a run and more of a hop, stumble, hop.  The first 17 miles took me 3 hrs and 12 minutes; the reciprocal took me almost 5 hours.  After the race I iced the knee, but 12 hours later it was still stiff and unresponsive. I knew that this a clarion signal that “the time had come”.  However, within a week I could run again, and against all rational judgements I began to believe I could “will” my knee to last a few more years.  In cognitive sciences this is called Unrealistic Optimism or Optimism Bias, which is defined as “cognitive states that are unrealistically optimistic are belief states, whether they are false, and whether they are epistemically irrational.” Most people that have the so called type A personality can relate –  it is the illusion of control, an exaggerated belief in one’s capacity to control independent, external events.  There are lots of benefits to unrealistic optimism – many people call this “extreme will power” – but it rarely results in miracles.

thebeginnig

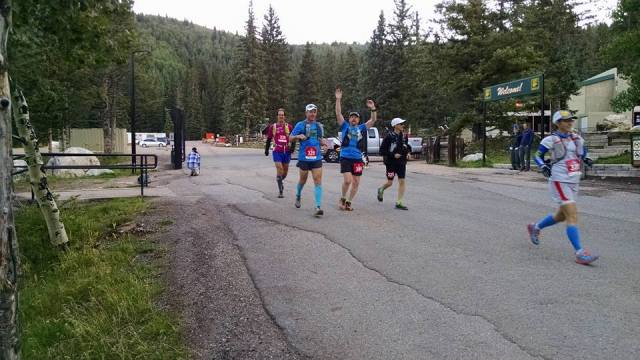
The last race…the Santa Fe Ultra with Dave Zerkle and Dave Dogruel escorting me through 34 miles of up and down, only to finish DFL.

I continued running ultras for the 10 months after Canyon de Chelly.  In fact, I ran 5 races of 50 km or greater, and logged some 2,100 miles in training.  But the expiration date had passed on my left knee (I assign the expiration date to the  Canyon de Chelly ultra), and my run began to more resemble a hobbled wobble than a graceful galloping gait.  My last race was inaugural Ultra Santa Fe race in the Sangre de Cristo mountains above Santa Fe. The race is a circuit from the top of the ridge line at 12,000′ to the juniper covered arroyos at 7,200′ along the eastern margin of the Rio Grande Valley (https://wallaceterrycjr.com/2016/09/20/the-santa-fe-ultra-lost-climbs-friends/?iframe=true&theme_preview=true ).  This is a tough and beautiful event – I really like this race – but for me it was truly the end. I finished the race DFL, and was incredibly fortunate to be escorted by my friends and faithful running companions Dave Zerkle and Dave Doggrel. The will was there, but the way was not.  The day after the race I began to plan my next journey; one final knee replacement, recovery, and then completing the Noles 14 14ers course in 2019 (I am not stupid – I never thought about doing this ridiculous trek in 60 hours; I am shooting for 120 hours!).

diagram

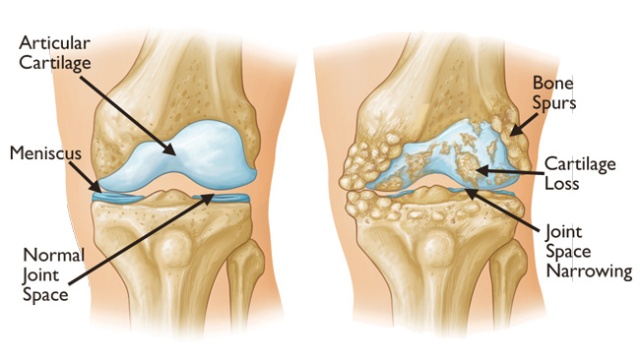
A cartoon depicting the deterioration of a knee due to osteoarthritis.  The loss of cartilage causes the knee to compensate, and often the victim begins to develop a bowleg stance.  The knee also loses its ability to lock.

Knee Surgery Stinks!

I am not particularly special in having a full knee replacement. Nearly 700,000 people have a partial or full knee replacement annually in the US.  Osteoarthritis is the most common joint disease in adults, and its incidence increases with age.  However, the expression of joint damage is usual minor for the vast majority of the population – only about 8% of the American population develops serious damage, and 75% of those are older than age 60.  My superpower is that I can have been able to destroy cartilage from a very young age.  When my hip was replaced in 1998 the surgeon told me I have the strange combination of a hip joint of an 80 year old, and the bones of a 25 year old; the cartilage was gone, but the bone was extremely healthy as measured by density and strength.  I have been struggling joint issues for at least 30 years – and likely this struggle was associated with pain (I say likely because I have a hard time with identifying joint pain). A recent study in the journal Pain (yes, there is a medical journal with the eponymous tag for something we all experience) looked at the human ability to manage long term pain (Brown et al, 2015).  “The experience of pain in humans is modulated by endogenous opioids, but it is largely unknown how the opioid system adapts to chronic pain states….however, our study is consistent with the view that chronic pain may upregulate OpR availability to dampen pain”.  Although the language is particularly opaque, the summary of the study is that for arthritis sufferers the body adapts to the pain.  This seems pretty logical – but it also one of the greatest sources of frustration when one approaches surgery.  Over and over the question the physician, x-ray tech, physician assistant, etc (including the hospital billing agent!) asks is “please quantify the level of pain you are experiencing in your knee.  They ask you to use the chart below as a guide so you can give the pain level with a numerical value.

painguide

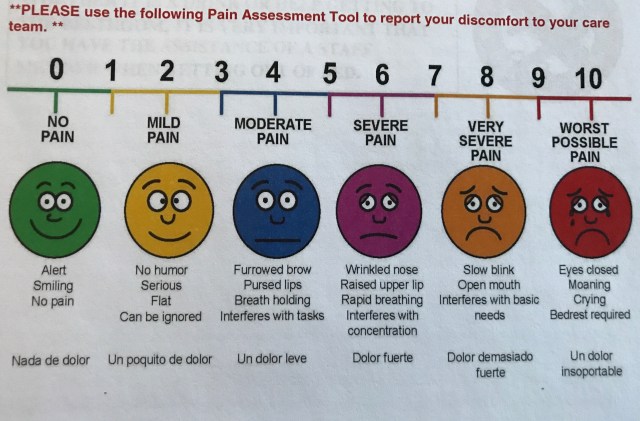
This is the famous “pain chart”.  Please quantify your level of pain, and just in case you are having trouble use a mirror and look at your facial expression.

I usually answer “I don’t really have much pain, I just can’t really walk”.  This leads to an downward spiral of a conversation: “Well, if you don’t have pain then we really should not perform surgery”….”But I can’t walk”….”So, is it painful to walk, and how painful”…”Nothing is as painful as this conversation, just frick’in understand I can’t walk anymore”….”I will record that you have a high level of pain”…”Thank you, and I do believe that I presently have a pain in my butt, level 8 (see the slowly blinking eyes and open mouth in the chart above)”.

Despite this loopy dance about joint pain, make no mistake, once you start down the path to knee replacement it is all about pain.  The damaged joint is painful even if you have adapted to the pain – it effects not only the way you walk and sit, but the way you sleep and stand. The ultimate goal is relieve that pain, but the joint replacement is a violent invasion on the knee, and the new pain, although ephemeral, is hardly trivial.

Comparison of my left knee pre-surgery, and the knee of a “normal” male, 36 years old. My knee, on the right, has bone on bone contact, bone dissolution due to knee-cap aggravation, and a wide gap on the left side due to long term adaptation to the irritation. The wide gap is common, and causes the development of a bow legged gait.

The goal of a full knee replacement is to remove damaged bone and replace it with new materials that allow the knee a full range of smooth motion.  The picture above shows my left knee pre-operation; The femur and tibia are touching on the left side and all the cartilage is gone.  That constant contact has caused a gap in the bones on the right side – this is one of the body’s adaption mechanism to the pain.  Unfortunately, it also changes the biomechanics of leg motion, and caused my leg to become “bow legged”.  Finally, the constant contact of the patella on the knee sans cartilage has prompted some bone dissolution giving the knee an a appearance of limestone fossil.  Several figures above this text is the x-ray of my replaced right knee; the damaged areas have been cut away and replaced with metal and flexible cushion constructed of polyethylene.

The reason knee surgery stinks is the processes involved in placing the prosthetic into the knee – to relieve pain, one must cause pain.  However, I am reminded of words of Benjamin Franklin:  There are no gains without pains. After months of planning, I arrive at the hospital to be checked in for surgery.  Although I have been through this several times before, it is impossible not to be anxious.  Plus, I am a paranoid worrier – I have spent the last two weeks planning for every disaster.  I visited the grandkids, I told my wife what to do with my mineral collection, I cleaned up my office…. Anyway, checkin and finally getting ready for surgery is just the start.

Modern knee replacement is miraculous.  The first process is deadening the legs, and that is done with a spinal block, the injection of anesthesia into the fluid surrounding the spinal cord in the lower part of my back.  Within about 5 minutes my feet feel hot, and then numb.  The numbness rolls up both legs, and within 15 minutes there is absolutely no feeling below the waste.  It is a bit freaky in that there is complete control and feeling from the belly bottom up, but nothing at all below.  Shortly after the anesthesia takes hold I am wheeled into the operating room.  Next to the operating table are several small saws – a frightening sight!  However, the staff give me a mild gas and I am fast asleep.  Next thing I know I am waking up 2 hours later in a recovery room. I missed all the action!  My surgeon sliced my leg open along an 8″ line from slightly above the knee to below.  This slice cut through the quadricep tendon and allowed access to the knee cap. Once the cut is made, my surgeon bends my knee 90 degrees to have access to the bone.  He then uses the saws to remove the bottom of the femur and the top of the tibia.  Another saw is used to reshape the bones to fit the parts of the artificial joint.  The new parts have pegs that are pressed into the bone, and will be eventually inter-grown with the new growth of the bone.  Then my surgeon focused on reshaping my knee cap – removing the spurs and rough spots.  After all this stuff is done the knee is straightened and the muscle is stitched up, and finally staples are applied to pull the wound together.

IMG_1707

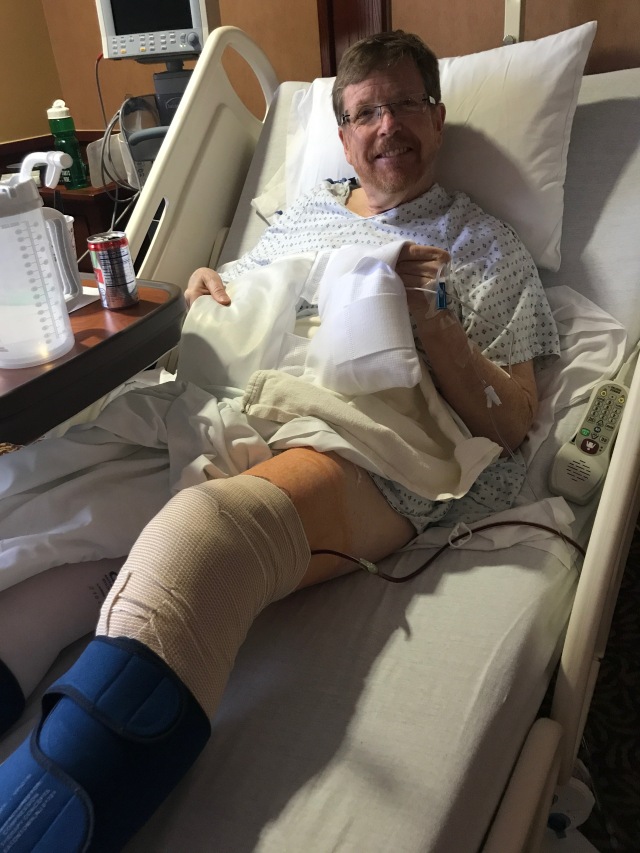
Four hours after surgery.  A new knee! blood drain means the bone marrow is still working.  My smile is due to the drugs.

There is no pain for several hours – until the spinal block begins to wear off.  Then all that violence to the bones screams. There is a long tube in my knee that drains the excess blood.  Since the bones were cut, and the prothesis was pressed in, blood continues to ooze out of the joint for 24 hours – in my case it was nearly a quart. Nothing feels good 12 hours after surgery is done.  However, the journey to walking, hiking and running has begun!

IMG_1717

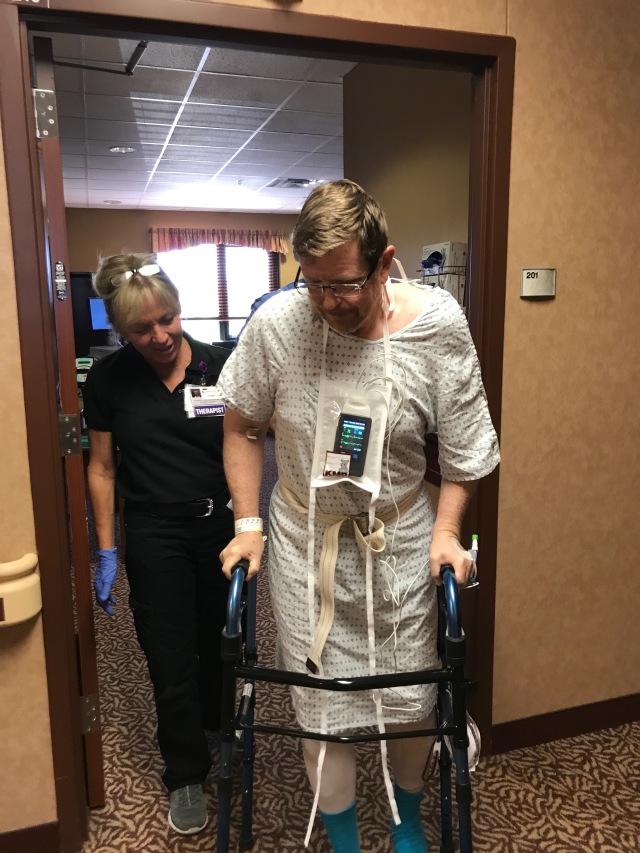
My first steps – not exactly freedom, but way better than bed rest!

First Steps: 18 months of recovery

The day after surgery the recovery begins.  With knee surgery there are so many nerves and muscles cut you have to learn to walk again.  Heel down, rolling to the toe – it seems natural, but I have to think about every step.  The leg that was operated on is weak, stiff and sore.  Walking 100 feet is a chore – but also a delight.  Pushing a walker up and down the hospital hallway is a bit surreal.  But the walker is my friend for 6 weeks.  Crutches don’t teach you to walk; the prothesis corrected my bowleggedness, the goal now is to be able to “lock” the knee.  It has been 10 years or more since I could lock the knee – as the arthritis progress that knee slowly buckles (lay flat on a bed – the back of a normal knee rests on the mattress, but an arthritic knee like mine with have a gap of several cm).

I know that the process of relearning to walk, making the knee functional, and strengthening the leg will take 18 months.  There is no way to shorten the recovery.  Past experience tells me that the first 6 weeks seems like an eternity and progress is frustratingly slow.  But the day the knee locks, then I will know that I am on the cusp of full functionality.  Locked and Loaded.  See you on the trail in 2019!

Collisions at the Bottom of the World II; Ice and Granite

It was soon after I began collecting stones, i.e., when 9 or 10, that I distinctly recollect the desire I had of being able to know something about every pebble in front of the hall door–it was my earliest and only geological aspiration at that time, Charles Darwin in his autobiographical notes.

img_1035

Sunset on the Cordillera del Paine as viewed from the south across Lago Sarmiento (picture taken 12/29/16). An amazing mountain range carved of granite crafted by the ice of glaciers.

The Cordillera del Paine is an awe inspiring mountain range. Although the Paine massif is modest in areal extent, it simply defies gravity.  Towering cliffs of white granite seem to magically jump out of the gently rolling hills of the Patagonia steppe.  I first saw a picture of the Torres del Paine – three impossibly slender yet massive towers of stone – in a National Geographic magazine in the 1960s.  The imagine was stunning and stayed with me for 50 years.  When I was 20 I imagined I would climb the towers; when I was forty I imagined I would scale the cliffs to the base of the towers; now that I am sixty I am thrilled just for the opportunity to trek to the glacial lake beneath the towers and drink in the perfection of nature.

I worked extensively in South America in the 1990s thru 2002.  Along with a few academic colleagues and a legion of outstanding graduate students, we deployed seismic stations across the Andes to record earthquakes.  These seismograms allowed us to image the structure of this remarkable mountain range, and help understand the dynamics of mountain building.  I worked in Bolivia, Peru, Chile, Argentina and Venezuela. Despite all the time in the field in South America, I never made it to Patagonia.  It was one of my great regrets; finally this year my wife and I vowed to remedy that regret.  We planned a trip to the “bottom of the world” and aimed to visit the Cordillera del Paine. It is  hard to describe the exhilaration of seeing the ragged mountain peaks, the white and blue ice of moving glaciers, and the rollings caps of waves created by the ceaseless winds blowing across lakes to a non-geologist.  Everyone thinks these things are beautiful, but to me they are more – they are are spiritual. They are the art work of a dynamic planet.

dixiefigure

Torres del Paine (the Towers of Paine) as sketched in Lady Florence Dixie’s book Across Patagonia (1881).

The first European account of the Cordillera del Paine was contained in a travel novel written by an amazing Scottish woman, Lady Florence Dixie, Across Patagonia. Lady Dixie was first and foremost a feminist, and then an adventurer and writer.  Her brother, Lord Francis Douglas was on a team that made the first successful ascent of the Matterhorn in July 1865 (although he died on the descent – a lesson that all mountain climbers learn; the job is to get to the bottom not the top). In 1878-79 Dixie traveled across Patagonia – she chose this adventure because “few European men, and no women had ever visited it”.  After traveling many weeks across the wind swept Pampas she was startled at the majestic rise of the Andes.  Her description upon catching her first glimpse of the Cordillera del Paine:   “From behind the green hills that bound it rose a tall chaine of heights, whose jagged peaks were cleft in the most fantastic fashion and fretted and worn by the action of the air and moisture into forms, some bearing the semblance of delicate Gothic spires, other imitating with surprising closeness the bolder outlines of battlemented buttresses and lofty towers….three huge Cleopatra peak rising from out of the snow glaciers far ahead of us.”

dsc01030

Cleopatra Needles, 140 years after Lady Dixie visited (photograph 12/29/16).

Dixie’s description resonants with me.  It also causes a few pangs of jealously.  What it most have been like to see something such majestic landscapes without expecting it? Discovering the impossible!  Our trip was planned to see both the great granite spires and the glaciers that relentlessly carve the rock away. Of course, unlike Lady Dixie, we had expectations on what we would see.  However, “seeing” the Cordillera del Paine in pictures is nothing like physically standing in the shadow of a 3,000 foot shear cliffs.  The long journey to the bottom of the world was amply rewarded.

fig-1-present-day-setting-of-the-antarctica-south-america-connection-and-tectonic

General tectonic setting at the bottom of the World.  The bulk of South America is shaped by the interaction of the South American continental block and the subduction of the Nazca Oceanic plate beneath it’s western margin.  In the far south the tectonics are far more complex and have evolved significantly in the last 25 million years.

Geology at the End of the World

The story of the Cordillera del Paine is both short (in time) and sweet. But, it is different than that of the rest of the Andes, and that makes it history complex. The Andes are spectacular mountains that occupy the west coast of South America, stretching nearly 7,500 km from Colombia in the north to Chile in the south. They contain peaks second in height only to the Himalayas; Chimborazo in Ecuador rises to 6,277m, Huascaran in Peru is 6,768 m, Tocorpuri on the border of Chile and Bolivia is 6,873 m, and the highest mountain in the Western Hemisphere, Aconcagua at 6,950 m, marks the boundary between Argentina and Chile. Incredibly deep valleys and impassable terrain break the line of towing peaks, which are often capped with glaciers. In some places the Andes narrow to only 35 km, whereas in Bolivia they divide into two ranges and bound a high-altitude plateau, the Altiplano, which is nearly 640 kilometers (400 miles) across. The imposing mountain chain shapes the ecology of the entire continent by forming a barrier to moisture, which usually travels from the Atlantic toward the west. The peaks trigger enormous rainfall that feeds the great Amazon jungle, leaving little moisture for the incredibly dry Atacama Desert, where decades may pass without measurable precipitation.

Convergence between the continental South American plate and the oceanic Nazca plate gives rise to the Andes; the subduction or consumption of the Nazca plate beneath South America is a violent and spectacular geologic engine. As the Nazca plate descends beneath South America into Earth’s mantle, the sediments, minerals, and rocks carried downward respond to the increasing pressures and temperatures by melting. In turn, the melt rises toward the surface and erupts in spectacular volcanoes.

In southern most Chile the subduction boundary between the Nazca plate and South America ends.  There is a triple junction near the Taitao Peninsula; this is the junction, called the Chile Triple Junction (CTJ), and marks the interactions between the Nazca, Antarctic and South American plates.  South of the junction Antarctic subducts beneath South America, but at a much slower rate than the Nazca subduction north of the triple junction.  This marks a major change in the Andes – and this is the reason Patagonia is “different” than the rest of South America.

darwinsgeologymap

The very first geologic map of Patagonia was drawn by Charles Darwin ca 1840.  There is no evidence that Darwin actually gazed upon the Cordillera del Paine, but the father of evolution theory clearly understood Patagonia was a very special place.

Charles Darwin visited South America during the 5 year voyage of the HMS Beagle (1831-1835).  Darwin wrote extensively on the geology of the continent;  On the connection of certain volcanic phenomena in South America (1838), On the distribution of erratic boulders and on the contemporaneous stratified deposits of South America (1841)and a classic book Geological Observations on South America (1846).  It is fair to say that Darwin’s geologic insights were not as deep as his thoughts on plants and animals.  However, in the preparation of his book he did draft the first geologic map of Patagonia (figure above).  This map was never published but is the Darwin archive at Cambridge.  Although it is highly simplified, it does capture the broad geology of Patagonia; mountain ranges in the west that have uplifted sediments that had been deposited in a shallow marine basin located in the Atlantic ocean. Most of the exposed geology in Patagonia was created by the history of the CTJ.  Around 15 million years ago the southern most section of the Nazca Plate and its spreading ridge were subducted and the CTJ was formed.  The CTJ migrated northward to its present location as more and more of the Nazca Plate is consumed.This migration is accompanied by localized intrusions of granitic laccoliths (sheets or domes of igneous rock injected within a sedimentary sequence of rocks).

img_0934

A view of the great Paine Massif from across Lago Nordenskjol.  The white colored rock is the a series of granites injected 12.2 million years ago; the dark rocks are ~100 million old marine sedimentary rocks that “received” the injected laccolith. (picture taken 12/29/16).

The CTJ passed the area of present day Torres del Paine about 13 million years ago, and ~12.2 million years ago the Cordillera del Paine laccolith was injected into gently dipping sedimentary rocks formed in a sedimentary basin between 60 and 100 mya.  There were at least 5 pulses of injection over a 50,000 year interval.  The laccolith has an areal extent of 10 x 20 km, and is 1800 m thick at its maximum.  This laccolith uplifted the surrounding sediments – it looked like a large bubble on the Patagonia landscape.

crosssection

A notional cross-section through the Cordillera del Paine.  The main intrusion is the sausage shaped unit denoted with “+”.  To accommodate the intrusion the sediments folded and faulted.

The intrusive phase was remarkably short lived, and as the CTJ continued its migration north there was no further magmatic activity. Around 10 mya the region of the Cordillera del Paine was probably a broad highlands, with minor peaks.  Starting in the late Miocene (~5 mya) the region began to be covered with a large ice sheet, and the erosive forces of ice began to carve the del Paine into to the familiar landscape of today.  Interestingly, the first scientific observations about Patagonian glaciations were presented by Charles Darwin who, along with Robert Fitz Roy explored Patagonia 150 km north of the Cordillera del Paine. Darwin postulated that “miles of rock” had been removed by ice.

It is hard for the average person to understand the incredible power of large scale glaciers.  In optimal settings glaciers can erode up to 1 m of bedrock for every 1 km of sliding.  Given a few million years the persistence of gravity dragging ice across granite, shale and sandstone will carve canyons 1000s of meters in depth. Today the glaciers have surrendered their massive size to a warmer climate.  The ice is still the primary erosion element in the Cordillera del Paine, but it is orders of magnitude smaller than it was 20,000 years ago.

rainbowfjord

Heading up Seno Ultima Esperanza (the sound of last hope) to Monte Balmaceda and glaciers on the boundary of Torres del Paine National Park. The rainbow is created by the constant winds blowing spray into the air (picture taken 12/27/16).

West of the Cordillera del Paine is the Campo de Hielo Sur, or Southern Patagonia Ice Field. This is a massive extra-polar set of glaciers that covers nearly 12,500 square kilometers.  The ice field offers the best view of the glaciers near Torres del Paine; traveling up some of the large fjords allows a close up examination of these glaciers.

dsc00996

Serrano glacier on Balmeceda, just south of the Cordillera del Paine.  The glacier is in rapid retreat due to rising temperatures.  Only 25 years ago the leading edge of the glacier was at the point that this photograph was taken (12/27/16).

One of the most famous glacier at the southern end of the Southern Patagonia Ice Field is Serrano.  Serrano is a “valley glacier” that  connects the ice pack on the high elevations of Monte Balmaceda, and terminates near the Seno Ultima Esperanza.  The valley glaciers are a delicate feature; they depend on air temperature and ice being deposited at the glacier head. Surprisingly, the ice creation is most important feature for the health of the Serrano (and other valley glaciers). A area is surprising arid – the annual precipitation rate at Natales, a town on the Seno Ultima Esperanza, is only 11 inches per year (about the same as Tucson, Arizona).  The Serrano is still an impressive glacier, but it is rapidly retreating.  The retreat is due doubt related to a rising temperature, but it is also the product of a decades long drought that is thinning the ice field.

glacialerraticsyy

Float ice below Serrano glacier, and a great glacial erratic.  The rock perched on another rock in the lake are materials that the glacier removed from high up the mountain and when the ice melted left stranded.

The geology of the Cordillera del Paine is one of granite and changing plate boundaries. However, the artistry of the Paine is the handiwork of the ice that has flowed across the granites for millions of years.

Geo-Paparazzi disguised as Trekking

The pictures I saw in National Geographic when  I was ten years old made me dream of  climbing the Torres del Paine. However, certainly by middle age, I realized I had trouble even climbing a rope, and I was much better suited to hiking and scrambling, so there was never any chance I was going to scale anything like the towers.  When I was in my 40s I hiked many high mountains in the Andes including some 6000m peaks, but they were not technical (one of the advantages of climbing in the Andes is that it is possible to get high with persistence and planning, even without much athleticism). When I first was planning my visit to the Cordillera del Paine I had visions of trail runs to the bases of all the peaks I had dreamed of climbing, but in the end, the trip was about simply being able to trek around the stunning geology of Torres del Paine.

anelevationmap

Map of the Paine Massif.  The stars are the Torres del Paine (and the glacial cirque below them) in the east, the Cuerno (Horns) in the center, and Paine Grande (the highest point in the Cordillera) in the west.

The verticality of the Paine Massif becomes immediately obvious when you plan a trek.  The glacial lake bounding the southern extent of the range has an elevation of approximately 250′; the highest peak, 2 miles north of the lake has an elevation of 9,426′. That massive wall of elevation is a sequence of cliffs isolated by deep valleys.  It is hard to get to the higher elevations – the climbs are often technical, and the Park controls access (both for safety concerns, and for ecological concerns).  However, simply cruising in the shadows of the towers is an extraordinary experience.

img_1006-1

Michelle Hall and I on one of the trails that eventually leads to the Paine Massif in the background, and on up to the Torres del Paine, just out of view on the right of the photograph.

We planned a trek of two days that took us from the western edge of the Paine Massif to a high glacial lake at the base of the Torres del Paine. The weather of Patagonia is legendary; every day often sees bright sunshine, rain, mist with visibility of no more than a few yards, and wind — oh, so much wind. The joy of the weather is that you know it will change (and change back again).  We started our trek on the shores of Lago Nordenskjold beneath the Cuernos, or Horns of the Paine.  Nordenskjold receives all the melt waters from the mountain glaciers in Cordillera; its milky green color reflects the large sediment content carried from the melt waters. This sediment is the finely ground rock remains caused by the glacier scraping the bedrock.  This fine grain material is called “rock flour”.

img_0977-1

Looking across Lago Nordenskjold to the horns.  On the left is Cuernos Principal, and on the right is Cuernos Este.  The contrast between the black of the shales and the white of the granite make this one of the most iconoclastic views in all of geology.

The view of the Horns is breath taking – and almost impossible to capture with a camera.  The contrast of a deep blue sky, low white clouds, pale white granite, black sedimentary rock and the green lake water make the view seem artificial.  The colors look more like they were conjured by an artist in a painting, than by the subtle hand of nature.  The tallest of the horns is Cuernos Prinicipal, and has an elevation of about 8,600′ (or a vertical scarp of 8300 above the lake). As the map at the top of this section of the blog shows that the majority of the great laccolith has been removed by glaciers – only 10 percent of the granite remains.  The spectacular view is a dying gasp of a great mountain range.

dsc01017

Salto Grande.  A water fall that captures flow from Lago Nordenskjold to Lago Pehoe.  The water color of the various lakes depends on how much glacier runoff enters the lake.  Green colors mean that there is a significant amount of sediment, or rock flower, from glaciers.  Blue colors have little to no sediment.

Nordenskjold lake drains into Lago Pehoe, which in turn drains into Lago Toro, and finally into the Serrano River and on to Seno Ultima Esperanza. Nordenskjold and Pehoe are about 150′ different in elevation; this difference creates a water fall called Salto Grande.  The odd color of the water makes for a scenic, and unique, cascade.

The views from the Cuerno group to Torres del Paine are all stunning.  In fact, the views inflict soreness in the neck as the head is always looking up! The views also impede the progress in trekking to the east.  But the main event is in the east, the climb up to the towers.

img_1038

The trail to the Torres del Paine.  Valle Ascencio.  The path from the base of the Ascencio to the glacial lake is about 5 miles.  The first few miles are a rocky climb, but then the trail enters a lush forest.

Our climb up to the Torres del Paine starts on day two, and in less than auspicious weather conditions.  The morning is misty and intermittent rain, and it is impossible to see the Cordillera. We are hiking with a guide, and he seems to be preparing us for the likelihood that the towers will be invisible even up close.  The path is steep, but well traveled and for the first several miles the low clouds and lack of vegetation make the journey tiresome.  However, at about mile 5 we enter a dense forest of Patagonia birch trees.  These trees are a remarkable hardwood, and are coveted for their longevity in construction (hundreds of years!).

img_1045

Lush forest along the trail – the tree is lenga (Nothofagus pumilio), a variety of birch.

The last 1 km of the trek to the base of the towers is a scramble up the boulder field associated with the mountain glacier connected to Torres del Paine. The 1000′ climb is rewarded with an extraordinary view – and a sudden parting of the low clouds to allow the sun to shine in.

img_1052

The last km of the trek up to the view of the Torres del Paine is a scramble up the outwash from the glacier that carved the towers.  The elevation gain is about 1000′, and the tough climb makes the reward of the view even more sweet.

The elevation of the small glacial lake below the Torres del Paine is about 3200′.  The tallest of the towers has an elevation of approximately 8200′ (the exact elevation of the towers remains in dispute, and no accurate survey has been conducted). 5000 feet of granite relief!  Although the weather cooperated, pictures of the three towers simply do not do justice to the stand of rocks.  They are unlike anything else in the world – true spindles that are nearly vertical.  Torres del Paine translates to Towers of Paine, where paine means “blue” in the native Tehuelche language.   The blue is in reference to the apparent color of the towers, especially in late afternoon.  On a cloudy day it seems a stretch to call the granite blue; but the color is not the compelling feature.

img_1116

The view of the Torres del Paine on December 30, 2016 at 11 am in the morning.  For a brief period the clouds opened up and presented the image of the fierce teeth in the jawbone of some ancient dinosaur.

I took approximately 1 million pictures of the towers.  Strangely, they all looked the same once I got back to the hotel and looked at them.  I struggled with the enormity of the landscape.  The south tower, the one on the left in the photo above was first climbed by Armando Aste in January 1963. Climbs of the towers remain some of the most difficult in the world, and attract the best alpinist every January. In 2015 two Chileans and an Argentine climbed all three towers in three days!

img_1108

A look back toward the Torres del Paine near the end of the trail.

Reluctantly, after an hour of picture taking and tasting the water in the lake (glacial runoff!), we had to leave and trace our path back to catch a ride to the hotel.  The journey down was rainy – the clouds began to move in, and we were reminded how lucky we were to have summited in relative sunshine.  Those few hours of trekking up and back to the Torres del Paine made all the difficulties of traveling to the bottom of the world worthwhile.

img_1142

Flying from Punta Arenas to Santiago we passed over the Cordillera del Paine – and got this extremely rare view given weather conditions and cloud cover.  The large glacier is Gray Glacier, and the green lake in the right center of photo is Nordenskjold. The Cuernos Principal is visible to the left of the jetty in Nordenskjold.

What will the future bring?

The Cordillera del Paine is truly a “wonder of the world”.  It is small in size – smaller than the Grand Tetons in Wyoming – but nature has conspired to build something that stretches the human experience.  About 150,000 people visit the park annually (compared with 2.8 million that visit the Grand Tetons for hiking); roughly 20% of those choose to trek into the interior of the park.  The park is strict about staying on trails, and requiring registration and tracking for all visitors.  However, it is not the same experience that Lady Dixie must have had 140 years ago.  The biggest difference is the retreat of the ice.  The glaciers in the Souther Patagonia Ice Field are all shrinking; there has been an areal loss of more than 60 sq km since 1945.  The loss of ice is not important for the dynamics of the Cordillera – the glaciers long ago did their work.  But the ice is a fundamental part of the spirt of the mountains.

fabianoventuraalbertodeagostini

A view into Torres del Paine; the top photo was taken by Alberto De Agostino, circa 1920, the bottom view taken this year by Fabiano Ventura.  Although the towers look the same, careful observation will show that the glacier has nearly disappeared, and the glacial outwash has been removed over the last century creating a lake.

This year an Italian, Fabiano Ventura is photographing glaciers in Torres del Paine in the exact location as a Alberto De Agostino, missionary in Patagonia in the early part of the 20th century.  The contrast in his images shows the rapid change as the ice departs. Change is inevitable – in geologic terms this change is extraordinary powerful.  I don’t know what Torres del Paine will look like in 50 years…so I will return in 2 years after I recover from an new knee replacement.  I will be running the Torres del Paine Ultra! (http://www.ultratrailtorresdelpaine.com).

Collisions at the Bottom of the World I; The 2016 Puerto Quellon Earthquake

“In Yosemite Valley, one morning about two o’clock I was aroused by an earthquake; and though I had never before enjoyed a storm of this sort, the strange, wild thrilling motion and rumbling could not be mistaken, and I ran out of my cabin, near the Sentinel Rock, both glad and frightened, shouting, “A noble earthquake!” feeling sure I was going to learn something”, John Muir, great American naturalist, writing about his feeling the  March 26, 1872, Owens Valley earthquake.

a-damaged-road-is-seen-after-a-quake-at-tarahuin-is-the-chiloe

Damage to the Pan American Hiway, just north of Puerto Quellon, Chiloe Island, Chile caused by a magnitude 7.6 earthquake on Christmas Day, 2016. Picture from various news services.

There is nothing more exciting to a seismologist than to feel the ground shaking during an earthquake.  The sense that the Earth is alive, that geology is dynamic, and for a brief moment in time it is possible to actually “see” tall mountains rise and deep valleys sink is palpable.  Alas, even seismologists rarely experience a large earthquake first hand – although there are 10-20 magnitude 7+ earthquakes annually, only a very few are located near population centers.  Seismologists mostly reside in the dingy halls of academic institutions, or worse yet, within the sterile offices of government agencies (first hand experience). It is only with great serendipity that seismologists have the happy happenstance to be standing on the ground above a suddenly slipping fault.  That “slip” is the breaking of rock caused by the accumulation of strain driven by the ceaseless movement within the Earth’s plates.  A small amount of the energy “released” by the rock breaking is converted to seismic waves that travel through the Earth.  The quote at the top of the article is from John Muir, and was his emotional response to feeling a large earthquake in Owens Valley 100 km from his cabin.  Muir’s words capture the pure joy seismologists feel when they recognize the vibrations from an earthquake.

img_0649

Flying south from Santiago towards Chiloe early on Christmas eve, 2016.  The view is to the east, along the drainage of Laguna del Maule.  The fold and thrust belt of the central Andes is outlined by the low fog; parallel sub-ranges trending north-south.  I instrumented the Valley for a structural study in 1999.  Just beneath the plane is the epicenter of the 2010 magnitude 8.3 earthquake!

My wife and I planned a trip to visit southern most Chile to celebrate our anniversary over Christmas break.  The highlight of the trip was a visit to Patagonia (which is a subject of the article “Collisions at the Bottom of the World II), and trekking within Torres del Paine national park. I worked on various seismic experiments within Chile in the 1990s, but I never had the opportunity to visit Patagonia; I love the high Andes of central and northern Chile (along with Bolivia and Argentina), but pined for the “Blue Towers” at the very end of South America.

The long planned anniversary trip started not the most auspiciously—plane mechanical issues and gross incompetence by American Airlines meant we missed our plane to Santiago not once, but TWICE;  we arrived in Santiago on the evening of the 24th instead of the planned morning of December 22.  Finally, on Christmas Eve we made it to Chiloe, a beautiful island at the northern end of the Chiloe Archipelago. We were to stay a few days at an absolutely spectacular hotel, Tierra Chiloe (http://www.tierrahotels.com/tierra-chilo-hotel-boutique/). We planned for some trekking on the island mostly to see something unique culturally.  Earthquakes never crossed my mind, although that probably is a remarkable confession!  Early Christmas morning we arranged to trek on the Pacific Coast —and at the very beginning of our trek we got, oh so, oh so very close to the John Muir feeling of the “noble earthquake”.

bathchiloe

Location of Chiloe Island, southern Chile. Included is the bathymetry west of the Chilean coast.  The tectonics of South America are dominated by the subduction of the Nazca Plate beneath the South American Plate.  The spreading center is obvious from the bathymetry – spreading segments oriented mostly north-south separating Nazca and the Pacific plate.  The bottom of the figure shows the end of the Nazca and the beginning of the Antarctic Plate.

 Chile: Home of the Monster Earthquake

The entire coast line of Chile—all 2500+ miles of it from the border with Peru to the overlook into the Drake Passage, is a convergent boundary.  Mostly this convergent boundary is between the oceanic Nazca plate and the continental land mass of South America on the South American Plate.  The Nazca and South America are converging at a rate on the order of 10 cm/yr, and the Nazca plate disappears beneath Chile in a subduction zone.  This subduction gives rise to volcanoes, and the uplift of the Andes; it also makes Chile one of the most seismically active regions in the world.  In fact, Chile has seem more magnitude 8 earthquakes in the last 150 years than all other countries combined.

However, the subduction along the length of Chile is complicated by the oblique angle between the South American coastline and the Nazca-Pacific spreading direction.  In the north, the coastline is 1000s of km from the spreading center, but near Chiloe the spreading center is only a few hundreds of km from the coast.  The ocean crust of the Nazca plate is very young when it descends beneath Chiloe, and very old when it subducts beneath Iquique near Peru.  The young crust is very warm and therefore buoyant, thus it resists descending through the mantle.  This buoyancy translates to a very “stiff” subduction zone, and very large earthquakes.

large_eq-berkeley

The fault areas of mega earthquakes in southern Chile.  The largest earthquake known is the May 22, Chilean earthquake that ruptured a fault nearly 1000 km from north to south. (figure from Berkeley Seismo Lab)

In fact, the largest earthquake known occurred along the southern section of the Chilean subduction zone on May 22, 1960.  The figure above shows the area that slipped in that earthquake (the pink color).  The earthquake ruptured a fault that started in the north (the epicenter of the earthquake) and moved to the south almost 1000 km.  The fault had a maximum slip of about 25 m – an extraordinary number! A single earthquake moved one side of the fault almost 100 feet relative to the opposite side. This earthquake created a huge tsunami that traveled across the Pacific ocean and caused fatalities in Hawaii and Japan.

castro

Damage to Castro, the capital of Chiloe after the 1960 earthquake.  Castro is located about 5 miles as the crow files from my hotel.

Seismologists measure the size of earthquakes with seismic moment, which is defined as Mo = u D A.  This simple formula states that moment (Mo) is the product of the fault slip (D), fault area (A) and the rigidity (u) of the fault (think of this as the strength of the rock that slips along the fault surface during an earthquake).  The long age of the Nazca plate translates to a large value for rigidity.  It is possible to convert seismic moment to a value of magnitude – which is not particularly useful to seismologists, but is very important to the public because of their familiarity with Richter’s magnitude.  For the 1960 earthquake the magnitude is calculated to be 9.6, by far the largest earthquake ever.  A careful examination of the map of the Chilean earthquake fault zone above will show that the very center of the fault is …. Chiloe!

The large size of the 1960 earthquake obviously causes every resident of Chiloe to treat terremotos with concern.  However, it is possible to calculate the average “return time” for the 1960 event by comparing convergence rate and slip in the event.  This return rate is about 300 years.  This means it is unlikely to have another monster earthquake (M > 9.0) near Chiloe in the next few decades; but it also means that great earthquakes (M>8.0) are going to happen every 50 years or so, and large earthquakes (M>7.0) every few decades.  In other words, when I made our plans for visiting Chiloe I should have AT LEAST THOUGHT about earthquakes!

img_0738

Looking south towards Mueller de las Almas moments before the magnitude 7.6 earthquake.  The bar is about 8 m high and was once exploited as a placer deposit.

 Missed it by that Much!

We started our Christmas day trek with a drive to the west coast of the Chiloe Island about 8:45 am.  Around 11:15 we made a stop near Cucoa on our way to Muelle de las Almas.  The stop was at a remarkable pebble bar that broke the surf. The bar is about 8 m high, and 30 m wide, and with every surge of the surf, the pebbles are pulled seaward causing a loud clacking.  The bar was once a site of a placer operation that recovered meager amounts of gold.  We were on a tight schedule or I would have explored the bar for much longer.  However, we got back into our 4WD vehicle and headed for the trailhead.  Within minutes of getting into the car we noticed that the power poles were swaying—the wires between poles looked to be moving 3 or more meters.  My first thought was where the heck did those hurricane force winds come from?  Within another few minutes we had started our trek and my phone went crazy with emergency notifications.  At first I thought they were from New Mexico, but closer examination, it became obvious that they where Chilean, and warned that a large earthquake had just occurred and a Tsunami warning was issued.  Soon, our guide was being called on his radio, and told to evacuate immediately.  A quick search showed that the USGS had reported a magnitude 7.7 (later downgraded to 7.6) earthquake under the southern tip of Chiloe – only 45 km south of us!

isoseismals

Isoseismal Map from the Chiloe earthquake (USGS).  The contours show regions of similar shaking. The earthquake was felt about 250 km away from the epicenter.

My strong inclination was to continue the trek and wait on a high ridge to see a tsunami come ashore.  However, I was over ruled by the guide (for the record, Michelle was voting with me – wait for the frick’in waves!). There were numerous reports of landslide, and within 30 minutes there were reports of 20 homes destroyed at Puerto Quellon.  Discretion once again trumped valor — we abandon the trek and headed back to the hotel.  Along the road we encountered numerous landslides, and cracked roads and bridges.

img_0749

Michelle showing one of many landslides covering the road back from the coast.  This particular slide nearly closed the road…but we squeezed through.

The earthquake knocked out power to the entire island, and broke water pipes up to 80 km from the epicenter.  When we got back to Castro there were lines of cars trying to fill up with gasoline – scores of cars at each station.  The lack of power and the concern of future earthquakes caused a mini-panic.  I don’t mean to give the impression of chaos, just concern driven by the haunting memory of 1960.

In the end, we ended up with a cancelled trek, a quiet afternoon looking for birds instead of interesting rocks, and thoughts about if we had only waited 10 minutes on the gravel bar we would have experience shaking with an intensity of 6 or 7.  Instead, we had the soft rubber of tires and the suspension system of a truck to damp out the shaking…missed it by oh so little.

There remains a remote chance that this earthquake is a foreshock to a large earthquake.  But it seems unlikely.  However, it is still a great anniversary present to an old seismologist on vacation.


Dead Presidents: Foggy Dew in the White Mountains in New Hampshire

Almost everything in nature, which can be supposed capable of inspiring ideas of the sublime and beautiful is here realized. Aged mountains, stupendous elevations, rolling clouds, impending rocks, verdant woods, crystal streams, the gentle rill, and the roaring torrent, all conspire to amaze, to soothe and to enrapture, Jeremy Belknap writing on the White Mountains in his book History of New Hampshire, 1793.

slivercascade2

Silver Cascade; the southern most end of the Presidential Traverse in the White Mountains. This water fall is at Crawford Notch, a narrow gorge that is home to the Saco River. Click on any photo to get a large version.

In 1816, Philip Cardigan, the New Hampshire Secretary of State, produced the first official map of the Granite State. He wrote of the White Mountains: “The natural scenery of mountains is of greater elevation than any others in the United States; Of lakes, of cateracts, of vallies it furnishes a profusion of the sublime and the beautiful. It may be called the Switzerland of America”. Although much has changed since the dawn of the 19th century, the White Mountains remain a magical place.  To a westerner, the statistics of the mountain range look pale: Mt. Washington is the high point – in fact it is the high point of the entire northeastern US at an elevation of 6,288 feet – but when you live at an elevation of nearly 7,500 feet this altitude seems pedestrian.  However, that western frame of reference misleads!  Mt Washington has a topographic prominence of 6,158′, which is greater than than any of the 14ers in the San Juan Mountains of Colorado.  Further, the tree line for the White Mountains is about 4,300′ (2000′ below the summit of Mt. Washington) as compared to 11,600′ in the San Juans.  The dominant factor in determining tree line is the average summer time temperature; Uncompahgre Peak (the high point in the San Juans) has a higher average summer temperature than Mt. Washington.

1816_carrigain_for_desc

The White Mountains of New Hampshire as depicted on the “Cardigan map”, dated 1816. The Presidential Range is represented on the map by the sort of strange stack of pancakes – not a very accurate representation of the actual topography.

In the fall of 2015 I signed up for a multi-day trail run in central New Hampshire, scheduled to take place in August, 2016.  Unfortunately, the trail run was cancelled, but the purchased plane tickets provided the opportunity to pursue something I have long wanted to do – hike the Presidential Traverse in the White Mountains.  The Presidential Traverse is a famous thru-hike; traveling a trail from end-to-end.  The Presidential Traverse (PT) is a relatively short – about 23 miles – but strenuous hike on in the Presidential Range, the northern end of the White Mountains.  The “challenge” is that there is about 9,000 feet of elevation gain, most of the mileage is above tree line, lots of boulder scrambling, and only the very lucky hiker escapes extreme weather changes (in August the temperatures at the trailheads are usually in the 80s by mid-morning, but Mt. Washington often freezes, is extremely windy, and is shrouded in clouds. In 1986 the record low August temperature of 20 F was recorded!).

mapofPT

Map of the Presidential Traverse; from Hiway 302 in the south to Hiway 2 in the north it is about 23 miles (there are many trail variations). Mt. Washington is the high point, right in the middle of the traverse. The starting point has an elevation of 1,110′ and the total elevation gain is approximately 9,000 feet.

Truth be told, when the multi-day stage race was cancelled I was despondent for about an hour, and then elated with the idea of doing the PT.  My first plan was to do the PT solo, and as a run.  Ultra runners of my modest skill level typically complete the transect in about 10 or 11 hours (the rocky course and slippery conditions slow down even the best runners).  However, my solo plan immediately tumbled into difficulty – especially the solo part.  My wise and loving, but very firm, spouse vetoed the “Into the Wild” act; she volunteered to accompany me, but we would make this traverse a fast hike, not a run.  Further, we would make it multi-day. The multi-day requirement was actually great – it meant more miles, more climbs, and more trails to explore.  But it also meant that the chance of a “perfect” weather window was vanishingly small.

mount-washington-observatory-tales-from-the-home-of-the-world-s-worst-weather

Rime ice on the summit of Mt Washington. Rime ice is formed by freezing fog that is blown by strong winds – it first freezes on an object at temperatures colder than the air, and then forms long tails in the direction of the wind.

I believe that my wife’s vision of the PT was shaped by a visit we took to Mt. Washington some 10 years ago.  Hiking in Pinkham Notch we were roasted alive (80 degrees with “cut it with a knife” humidity) and eaten by mosquitos, and then froze at the summit of Mt Washington with winds “only” 70 miles per hour.  I recall telling her how great it would be to battle the elements in a real storm. Mt. Washington is the deadliest mountain in the US – more than 155 people have died on the mountain since 1849.  Most deaths are due to exposure (and most often that exposure is because of unexpected changes in weather or hikers that take much longer than they expect). When my wife suggested that going solo on the PT was not my wisest plan I responded with a Hunter Thompson quote: “Life should not be a journey to the grave with the intention of arriving safely in a pretty and well preserved body, but rather to skid in broadside, thoroughly used up, totally worn out, and loudly proclaiming, ‘Wow! What a ride!” Seems that 60 years of life has not taught me that discretion is the better part of valor – and my Thompson quip was not received quite as intended. On the other hand, a hike along the Appalachian Trail over one of the most famous mountains in all the US was ample reward.

usageologicprovinces

The geologic provinces of the United States. The contiguous US has a varied physiography which is largely reflective of tectonic history. There are nine major provinces, and the eastern US is dominated by the Appalachian Mountains. Despite the appearance of being a continuous mountain belt, the Appalachians have differing and distinctive tectonic histories in the north and south.

Making of the White Mountains

The White Mountains are ancient – they were formed long before the modern Rockies, the Basin and Range, or the very young Cascadia Ranges in the Pacific Northwest. Yet, despite this primordial character, the White Mountains remain an imposing landscape. Giovanni da Verrazano, an Italian explorer (and strangely forgotten map maker considering his accomplishments!) first mentioned “high interior mountains of white color” in 1524 as he sailed up the New England coast after leaving an anchorage in Narragansett Bay (the coast of modern day Rhode Island).  Indeed, on a clear day, from the summit of Mt. Washington one can see landmarks 130 miles away.

relief.appalacia22

The Appalachian Mountains stretch some 1500 miles from northern Alabama to Maine, and are topographic remnants of multiple continental collisions over the past 480 million years. The northern Appalachians mountains have a different record of collisions than in the south, but overall the accordion landscape is all that remains of the opening and closing of many ocean basins.

This “high” elevation was created approximately 400 million years ago, but the birth of the White Mountains began some 750 million years before the present when the first “supercontinent”, Rohinia, began to be rifted apart.  Along the margin of one of the many rifts, the broad area that is today New England, became a coastal lowland on a new continental mass called Laurentia. The ancient New England coast bordered a broad ocean basin – this ocean is usually referred to as Iapetus. About 500 million years ago the ocean basin began to close due to a change in plate tectonic dynamics and the oceanic crust of Iapetus was consumed;  over a time period of about 80 million years  the oceanic portion of the tectonic plate was subducted beneath a growing island arc.

Taconic_orogeny

Cartoon of the building of the northern Appalachian Mountains from the USGS. Although there are some large scale granite intrusions in the White Mountains, the structure is dominated by collision of island arc and continental crust and the accordion like stacking of sediments and crustal fragments.

Eventually, the oceanic crust was completely subducted, and the edge of Laurentia collided with the island arc that had been formed above the subducting Iapetus plate.  More correctly, Laurentia collided with a series of island arcs as the ocean basins that had been created when Rohinia disappeared, and a new supercontinent was formed over a 150 million year period.  These collisions compressed, faulted, folded the converging crustal fragments and created a series of high mountain ranges.  The first collision and subsequent mountain building episode is called the Taconic Orogeny (the name comes from Taconic Mountains in New York and Vermont). The White Mountains were a direct result of this collision, which also accounts for most of the rock types that are seen along the Presidential Traverse today. Unlike the San Juan Mountains in Colorado, there was little volcanism (although there was some) involved in the original mountain building. The rocks that are mostly seen in the Presidential Range of the White Mountains are metamorphic – the Laurentia crust and Iapetus ocean sediments that have been squeezed, buried, heated and occasionally melted.

Although other continental collisions and rifting events occurred after the Taconic Orogeny, the geology of the White Mountains was largely set by about 400 million years ago. By the way, the zone of collision was much larger than what one sees today.  The Caledonides Mountains of Scotland and Ireland are really the siamese twin of the White Mountains – accreted onto the edge of Laurentia.  380 million years ago it would have been possible to hike from Mt. Washington to the Cairngorm mountains (south of Inverness). Eventually the collisions assembled a new supercontinent, Pangea.

pangaea.a

Notional map of Pangea, circa 275 million years before the present. Almost all the landmasses recognized as continents today were temporarily assembled into one large “super continent”. Around 185 million years ago, Pangea began to break apart along rifts and the modern ocean basins began to form.

Around 185 million years ago Pangea began to break up – rifts criss-crossed the giant continent, and Pangea was slowly pulled apart.  The “pulling apart” created new oceans, and Pangea was diced into continental fragments that would become our modern continents.  One of the rifts developed east of what is now New England, and the Atlantic ocean slowly opened.  This rifting process brought hot mantle rocks closer to the Earth’s surface, and wide-scale melting of the lower crust was common. This melting produces large granitic plutons – that may, or may not, have had volcanic vents at the surface.  Either way, the granitic plutons were hot and buoyant, and caused the White Mountains to rise in elevation. By 160 million years ago the crustal melting had ceased; the rock building history of the White Mountains ended.  It is possible to find the granites associated with the opening of the Atlantic, but they are mostly “beneath” the Presidential Traverse, and exposed in the incised canyons,which are known locally as the “Notches”.

Although the geology and elevation of the White Mountains was the result of very ancient collisions and rifts, the present day topography was carved by a much more recent phenomena, glaciation. Geologist define the Pleistocene epoch (the period of time from 2.6 mya to 11,500 before the present) as a time of massive glaciation in the Northern Hemisphere. The glaciation – or more correctly, the cold climate – was episodic, and the White Mountains were occasionally completely covered by a thick ice sheet (not unlike Greenland today). The most recent “ice age”, referred to as the Wisconsin, started about 80,000 years ago. The Wisconsin age produced an ice sheet called the Laurentide; about 30,000 years ago the White Mountains were about 1 km beneath the ice of the Laurentide.

glacierofPT

A map of the major alpine glaciers that carved the Presidential Range (map from Goldthwait, 1970). There are nine glaciers which are indicated by the gray regions. The largest was north of Mt. Washington and carved a cirque and glacial valley known as the “Great Gulf”

The Laurentide Ice Sheet retreated as the climate warmed, and exposed the White Mountains again about 13,000 years ago.  However, as the ice sheet retreated, alpine glaciers developed and carved cirques and U-shaped valleys that give the present Presidential Range its character.  The figure above shows the location of the 9 most prominent glaciers in the area been based on the geomorphic signatures seen today.

glacialerractic

A large glacial erratic in Franconia Notch in the White Mountains. This boulder was moved some 200 miles from the north by glacial ice, probably about 30,000 years ago. It is named after a teamster that sought shelter beneath the rock’s overhang during a blizzard in the early 1800s.

The rugged topography of the White Mountains is only a part of the challenge of any hike or run across the Presidential Traverse. Much of the fame of the White Mountains, and Mt. Washington in particular, is associated with its weather – it is often called “Home of the World’s Worst Weather.”  The sobriquet is well earned even if many want to quibble with the definition of worst.  Mt. Washington towers above the surrounding New Hampshire landscape, and by elevation rise alone has temperatures 30 or 50 degrees F cooler than the trailheads leading up to the Presidential Traverse.  Add in the fact that on average, the Mt Washington experiences winds in excess of 75 miles per hour on 110 days every year, and it can be a very cold place. The lowest recorded temperature on Mt. Washington was -50 F (January 22, 1885), and the lowest recorded wind chill reading was -103 F (January 16, 2004)!

storm_formation.a

Major storm tracks for the US – storms form in the west and “track” across the continent, usually strengthening. Three of typical tracks (the red below is known as the Alberta Clipper, the blue is called the Pacific, and the light red is called the Texas) converge on the Northeast – the White Mountains are in bull’s eye of storms for the entire year.

The weather conditions of the White Mountains are controlled by three things:  (1) the mountains are at the convergence of three major storm tracks, (2) the mountains are oriented north-south and provide a significant block to the predominate winds from the west, and (3) many low pressure systems are created off the New England coast due to the significant temperature difference between the landmass and the Atlantic ocean (these low pressure systems “suck” air across the White Mountains).  All three of these factors contribute to wind, and wind over mountains creates precipitation. Air cools as it passes up and over high terrain; as the air cools it loses it ability to hold moisture (first forming clouds or fog, and then rain and snow – this is called the Foehn effect).  Mt. Washington receives the equivalent of 97 inches of rain every year (“equivalent” because Mt. Washington receives 280 inches of snow every year!).  No season is spared the winds or precipitation – clouds shroud the top of Mt. Washington 60 percent of the time!

Washingtonsummit2

A view of the summit of Mt. Washington (8/12/16). I am standing about 10′ from the sign, and the visibility is not just different…the wind was blowing more than 45 miles per hour, and less than 90 minutes later a monster rain/hail storm would deluge the southern Presidential range. Hiking the Presidential is as much about weather as it is tough trails.

The White Mountains are both a geologic marvel, and a most amazing coincidence of circumstances with regards to weather patterns.  Darby Field, a 32 year old ferry operator is reputed to have been the first recorded person to climb Mt. Washington in 1642. I say reputed because academics love to argue if Field actually climbed to the top, or even climbed at all.  However, the Governor of the Massachusetts Bay Colony, John Winthrop, recorded an interview with Darby that appears remarkably consistent with the geography. It is hard to image what that first ascent was like; primitive gear, no appreciation for the weather changes, and likely no real planning for the ascent. However, if Field could make it to the top, then clearly a modern man armed with geologic knowledge, an keen eye for weather, and lots of snacks in a pack could cross the Presidential Traverse!

postcard3

Artistic rendition of the northern Presidential Range (postcard circa 1930). Mt Washington, in the center of the image, has an elevation of 6289′; the surrounding valley floors are on the order of 1000′.

Touching the Presidents

I arrived in New Hampshire with a plan for a 3-day hike (well, I was originally optimistic that I would be running some of the course – the trails and weather proved a far stronger force than personal optimism) in the White Mountains.  Day 1 was a “warm up” with a 9 mile loop near Franconia Notch; climbing up from the floor of the notch (elevation 1900′) to Haystack (elevation 4780′) crossing the Franconia Ridge to Lincoln (elevation 5089′) and on to Lafayette (elevation 5249′ ) before descending back to the floor. The Franconia Range is southwest of the Presidential Range within the White Mountains, and most of the rocks that are exposed are younger in age – primarily the granites associated with the breakup of Pangea.   The notch is a very narrow slice through the Franconia, and is perhaps most famous for a rock formation that looked resembled the profile of an old man (called Old Man of the Mountain).  Unfortunately, the rock formation collapsed in 2003 but not before the profile graced all the state hiway signs in New Hampshire and the backside of the US quarter commemorating the state (the perils of being famous for rocks….).

michellewaterfall

The ascent up the Mt. Lincoln Loop is along the Falling Waters Trail – homage to the numerous waterfalls on the first half of the climb.

The hike up to the Franconia Ridge is quite rugged – it is steep, rocky, and occasionally slippery.  It is also the arch-type White Mountain trail.  It was constructed in the 19th century and basically goes straight up; no switchbacks, no much taking advantage of contours.  In places the trail is a smoothed path, but mostly it is a hiway of rounded boulders varying in size from a few inches to several feet. Quad busting, ankle biting rocks.  I did see a couple of people “running” this section of the trail, but it looking more like hippos trying to get out of a water hole.

lincolnprofile

The profile for the Mt. Lincoln loop. The high peak in the middle of the profile is Mt. Lincoln, and the high point is Lafayette. The 3 mile climb to the ridge is a constant 15-35% grade.

It was a warm day (it was 82 degrees at the trailhead at 8:00 am), and it took us about 2 1/2 hours to arrive at Haystack.  It is a bit strange to be a few hundred feet about treeline, yet only at 4700′ elevation.  However, we were rewarded with great views – although the humidity limited the crispness of horizon.

IMG_0985

One of the better sections of the Falling Waters Trail – nature’s stair master.

Across from Haystack is Cannon Mountain, which is the former “home” of the Old Man of the Mountain. Cannon has an elevation of a little more than 4000′, and its most pronounced feature is a huge wall of exfoliating granite.

topofhaystack

View fromHaystack across the Franconia Notch to Cannon Mountain. The large exposure of rock is exfoliating granite – which also created the Old Man of the Mountain.

Once on Haystack the trail follows Franconia Ridge, and is mostly class 1 (maybe a class 2 section here and there).  There are many articles that describe the Ridge as a “knife edge”, but compared to the Knife Edge on Capitol Peak in Colorado, Franconia Ridge is a freeway.

IMG_0998

View from Haystack to Mt. Lincoln and Franconia Ridge. I really had to do this loop to get Mt. Lincoln – the greatest President, and did not want to disrespect him in any run of the “Presidential Traverse”.

I was hoping for a good view of the Presidential Range from Lafayette, but the haze associated with the humidity precluded an impressive visa of “towering” Mt. Washington.  It was hard to imagine that a major series of storm cells was moving into the area, and by tomorrow the weather would be rain.

IMG_1025

The summit of Mt. Lafayette. In the distance is the northern part of the Presidential Range. It is a tough 4 mile slog down with 3400′ drop in elevation.

The descent down Mt. Lafayette to the Franconia Trailhead is a slog.  It is a rocky trail, following the now familiar White Mountain tradition of vertical profiles and lots of boulders.  Michelle struggled with the descent – the trail taxes the small muscles that stabilize knees and hips (and not something that one strengthens by running road marathons).  By the end of the day she declares that she is done with these crazy hikes, and I am back to doing the Presidential Traverse solo, although supported.

mapoftherun

Route of the Lincoln Loop – warmup to the Presidential Traverse.

I awoke early Friday morning (8/12/16) ready to run the southern PT.  I studied the radar images long and hard – somehow I convinced myself that the storm track was mostly north of Mt. Washington, and I was going to have a miracle hike. Self delusion is an important skill for ultra runners – only equalled by the importance of a very short memory for pain and discomfort.  I was on the trail by 6:15 am; I took the Jewel Trail up from near the Cog Train station.  The trailhead had a temperature of 67 degrees and it was muggy.  I could not see Mt. Washington because it was shrouded in thick fog. The climb from the trailhead to Mt. Washington is about 5 miles and a gain in elevation of 3800′ (most of that gain is in the first 2.8 miles).

IMG_1037

A view from the Jewel Trail at an elevation of 4200′ feet (just about treeline) towards the southern PT. The distance ridgeline is Monroe, Franklin, and the final “hump” is Eisenhower. The dark skies were a harbinger of things to come.

The PT is one of the classic American mountain routes – it was first done in September of 1882 by a pair of hikers, George Sargent and Eugene Cook. They hiked the PT from north to south in about 20 hours, and since that time thousands have accomplished this feat. The fastest known time for the traverse was made by Ben Nephew in 2013; only took him 4hr and 33 minutes! I had no illusions about being “fast”, and after taking 2hrs 30 minutes to get the five miles to Mt. Washington I was pretty sure the FKT is fiction!

scatterquartz

Above 4,400 the fog rolled in and the wind began to roar. The visibility was 10s of feet by 5,000 feet elevation. The trail is marked with cairns which is the only way to not get lost. Along the trail are large blocks of white bull quartz – eerie ghosts in the fog.

The climb up Jewel Trail is very bucolic and although steep it probably is “runnable” to my colleagues back home. The path passes through several ecological zones. The trail starts in hard wood forest, and within about 1 mile and 1,000 feet elevation gain the vegetation is dominated by spruce and fir trees.  The tree line is around 4,200 feet, and the ground is covered with a dwarf spruce called kummholtz; after 4,400 feet there is only moss on the rock. By 4,400′ feet elevation the visibility on this day is only a few 10s of feet, and the wind is ferocious.  The trail in the alpine zone is not really a path, but a marked course through a rough jumble of rocks.  The course marking is done with cairns – mostly 3 to 5 feet tall, every 10 to 20 yards.  Even at that close spacing I find myself searching for the next cairn before venturing forward.  Along the way I see large blocks of bright white quartz scattered about, created during extreme metamorphism of the Taconic orogeny.  Often the keepers of the cairns have placed a block of this quartz on top of the rock piles, and they look like lighthouses in the stormy weather.  There also is some whimsy – several of the blocks have been carefully spray painted with gold metallic paint to look like nuggets of gold (a common association for the gold deposits of the western US). I am not fooled, but very amused!

IMG_1057

A large video display greets guests at the top of Mt. Washington. It shows the temperatures on the way up the mountain, the wind speed, and the precipitation. For my journey the wind speeds gusted to 55 miles per hour, and were steady at about 45 miles per hour. Later in the day they would reach 75 miles an hour.

I arrived at the summit a few minutes before 9 am.  The visibility is near zero, and the wind is really blowing, but it is not really cold – and most importantly, it is not raining or snowing.  Except for the employees, the summit is deserted before 9.  To understand the significance of the “deserted”, it is important to realize that Mt. Washington is the equivalent to Pikes Peak in Colorado.  There is an auto road to the top as well as a cog railway bringing tourists in flip flops and tee shirts to experience the “worst weather in the world”.  Annually about 250,000 people visit the summit (only about 12,000 hikers – and those hikers often have short tours near the summit).  I am meeting Michelle at 9:30 for some previsions and a check on my progress. By 9:30 the tour vans and trains begin to arrive, and their are at least 100 people freezing their asses off getting a photograph at the summit sign. In someways this seemed truly surreal.

leavingsummit

Leaving the summit of Mt. Washington to go down the southern PT. Beginning to rain.

The heavy fog and traffic coming up the mountain delays the arrival of Michelle and I getting very nervous.  There is a large video display of the weather radar, and it is clear that some nasty cells are soon to arrive.  I finally get on the trail about 10 am, and start down the Crawford Path toward Mt. Monroe.  The Crawford path runs the entire length of the southern PT (about 8 miles) and is the oldest trail in the US.  The trail was started by a Abel Crawford and son in 1819, and finished to the top of Mt. Washington in 1840.  Abel Crawford made the first ascent on the trail via horseback (!!) when he was 75 years old. As I start down the trail, it is rocky, but one of the best in the White Mountains. 30 minutes into the descent the winds increase, and everything becomes wet.  The rocks on the trail become first slippery, and then down right treacherous.  I can’t run because every step is an opportunity to stumble.  In fact, after about 1.5 miles descent I slip in the most precarious fashion – my right foot slips forward and my left knee is completely bent such that the back of my calf is touching my buttocks.  I have not bent like that since age 3 – I have the flexibility of dried wood in my ligaments.  In 2009 I had my right knee replaced and 2 months after surgery I was not getting the range of motion that I needed for full recovery.  This was “fixed” by a procedure called manipulation under anesthesia, or MUA.  MUA is ugly – after knocking you out the Dr. brutally flexes and bends your leg to break all the scar tissue that developed after surgery.  When you awaken your leg is black and blue, and it hurts like hell.  Well, the Crawford Path performed MUA on my left leg….just without the anesthesia.  However, there is no time to curse the misfortunate because the weather is getting worse.

IMG_1063

Lake of the Clouds – in a cloud (8/12/16).

I am sore, but able to slowly build pace, and arrive at the Lake of the Clouds which is located some 1200′ in elevation below the summit.  The lake is reputed to be quite picturesque – but I don’t really know as Lake of the Clouds was in the clouds. I did use the water of the lake to clean the scraps on my knee, but I mostly thought about King Arthur and Lady of the Lake. Alas, no one arose from the water with an excalibur for me.  The lake is in saddle between Mt. Washington and Mt. Monroe, so shortly after passing the lake (and passing by the Lake of the Clouds hut filled with people waiting out the storm) I have another climb.  It is dark now even though it is only around noon.  The wind is howling, and I am mostly hoping just for completion of my journey.

I arrived at Monroe (elevation 5371′), and I hear a very distant rumble – I think thunder! The descent down Monroe is pretty easy, and the next section of the trail to Mt. Franklin is actually runnable – and I run as fast as I can.  I pass three different groups of hikers coming up the trail, and offer my advice and condolences. More thunder, and it is 2 hours since I left Mt. Washington.  I sprint up Mt. Eisenhower (one of my favorite presidents, BTW – very underrated, but anyone that calls out the military industrial complex deserves kudos), and arrive at 2hrs 31 minutes since summit. Eisenhower is only 4760′ elevation, but it quickly becomes the eye of a storm.  Thunder is all around, and sheets of rain begin to fall. The rain does not last long – because it turns to hail driven by 50+ mile per hour wind.  I realize I am in trouble and bushwhack down the leeward side of the mountain and crawl into a small opening within a pile of rocks and wait out the storm. After about 30 minutes the thunder ceases, and the rain/hail becomes a thick mist.  I decide to bail off the PT ridge and head for the valley below.  I am disappointed – I came very close to finishing the southern PT, only missing Mt. Pearce.  I justify not visiting Pearce because he really wasn’t much of a president – he signed the so called Kansas-Nebraska act that enforced the capture of any fugitive slave in the 1850s.

IMG_1067

The Edmonds Trail after the storm – water, sometimes knee deep running in the channel carved by 100s of thousands of hikers over the last 200 year.

The hike of the southern PT amounted to a 11.4 mile jaunt with 5,130′ elevation gain.  The storm was epic – and certainly by early evening I was marveling at my survival.  Well, really, just happy to say the southern Presidentials were done.

Day three of the White Mountain adventure started auspiciously – I arose at 5 am hoping to be on the trail to climb the northern PT by 6 am.  The northern PT is infamous for it rocky trails, and I knew I was in for a long day even if the planned route was only 9 miles and 3,600′ elevation gain.  However, at 5 am it was raining; if it was raining at 1,000′ elevation what was it doing up on Mt. Jefferson (elevation 5,712′)? Depressed, and sore from my slips the previous day, I pondered my options.  Thankfully, Michelle counseled patience, and indeed the rain lifted by 6:30, and I was able to get to the Caps Ridge trailhead by 7:30.  Caps Ridge is a relatively high trail that travels straight up to Mt. Jefferson, the third highest peak in the PT.  However, it is not a “normal” trail – the last 1 1/2 miles to the summit of Jefferson is a fully exposed scramble.  Dicey in the best of times, but slick with rain and in the fog was “beyond epic”.

IMG_1070

The view from the Caps Ridge trail towards the ridgeline of the southern PT. There are two layers of fog – one on the valley floor and the second at 4,300′. That higher altitude layer would be a constant companion for the entire northern PT.

Although I had researched the Caps Ridge trail I was surprised how difficult it was – more slimy than slippery, and I slipped and slid many times.  The scramble would have been exciting another time, but being alone, far from “help”, my heart was working overtime.

IMG_1071

The beginning of the upper part of the Caps Ridge trail at about 4,200 feet elevation. Not a particularly welcome sight for someone that has no flexibility.

I was concerned that my flexed knee from the previous day would be a problem, but in fact it was just sore and not particularly stiff.  The scramble to the top of Jefferson was one of the hardest things I have done in years.  I banged my right knee, opening a pre-existing scab.  Blood pored forth, but there was no pain, so except for the fact that I looked like the “living dead” I was able to finally get to the top of Jefferson after 2hrs and 20 minutes.

IMG_1075

The summit of Jefferson. Just a pile of rocks in the fog. This is pretty much how Adams and Madison looked later in the hike, so I need not add photos of those summits.

Cell phone coverage was perfect on Jefferson, so I texted Michelle and told her that I was on course for a 3:30 arrival at Appalachia Way.  Little did I know that my views of 10′ feet or so into the fog were among the best I would have for the entire day.  I had visions of magnificent panorama of the Great Gulf, the huge, deep glacial cirque only a few hundred yards from the summit. Instead, I had to settle for my imagination, and the very strong desire just to plow through.  The trail from Jefferson to Adams is called the Gulf Way, and it is truly my least favorite trail in the entire world.  It is just a bunch of boulders, all waiting to cause me to slip.  I took over an hour to cross the 1.5 miles to Mt Adams (elevation 5793′ – second highest in the PT).  Mt. Adams turns out to be just a tall stack of boulders.  I found no outcrop what so ever.  If a mountain could ever be called ugly, surely Adams earned that moniker.

The trip over to the final peak on the northern PT, Madison, was uneventful if slow. I was running on determination, and not really enjoying the adventure.  Tagging the top of Madison sent a wave of relief over my soul, and I realized all I had to do was descend 3.8 miles and 3,500′.  The first 2000′ of descent were slow, but once I entered the hardwood forest the canopy provided protection from the rain, and it was possible to maintain a decent pace.

IMG_1080

Some type of fungus on birch trees – reminded me of how different New England was than New Mexico.

I finished the hike in a little under seven hours (for 9.2 miles…yes, a blistering 1.3 mile an hour pace).  It was a true adventure: 3 days, 31.7 miles, 13,932′ elevation gain.  I missed the vistas, but I also missed the crowds that had the sense not to be on the mountain in stormy weather.

theroute

The PT routes – day 1 and day 2. Just lines on a map now, but adventures in the fog when on the trail

It aint the Rockies

Hiking in the White Mountains is fundamentally different that running and hiking in the Rockies.  The trails are just different.  All the trails in the White Mountains were laid out in the 18th and 19th centuries, and simply were straight lines between point A and point B.  No switchbacks, no grooming.  I am sure that there are many talented runners and hikers that can hop from rock to rock and travel the Presidential Traverse with ease.  I am not one of those.  However, the PT was an adventure – in some ways it was exactly what I crave.  A challenge physically, a competition with nature, and a deep sense of history. Just no pictures – the fog rules the day.

The Golden Age of Mineral Collecting: Today is better than ever!

It was the best of times, it was the worst of times, it was the age of wisdom, it was the age of foolishness, it was the epoch of belief, it was the epoch of incredulity, it was the season of light, it was the season of darkness, it was the spring of hope, it was the winter of despair, Charles Dickens, in A Tale of Two Cities (1859).

proustite.cover

Mineral Collecting has evolved tremendously in the last 65 years. Many collectors bemoan the passing of the “golden age” when spectacular mineral specimens were available for purchase.  However, in terms of “classics”today is the true golden age (all thumbnail figures can be clicked for full-sized images).

In 1798 Thomas Malthus published his An Essay on the Principle of Population and postulated that catastrophe for mankind was inevitable because population growth is exponential and life essential resources (such as food and water) tended to only grow arithmetically. This simple essay gave rise to a school of gloom and doom, Malthusianism, that has been applied to everything from oil production to luxury items; basically, in a world of fast growing population the demand for commodities will eventually outstrip the supply, and the scarcity of the resources will lead to conflict and ultimately a decimation of demand. However, in the two centuries since Malthus first pinned his thoughts on the clash between supply and demand, the concept of “catastrophe” has been mostly avoided because the same demand that made resources scarce spurred unimaginable creativity and innovation. Between 1800 and the start of the new millennium the world’s population increased 6 fold, yet agriculture increased 10 fold! Many more people, and even more food – and the supply vs demand dynamic was tipped on it’s head.

malthusian_theory_of_population_growth

Malthusianism — population and demand grows exponentially, while supply of resources increases arithmetically. When demand exceeds supply new dynamics happen – perhaps disaster, or perhaps innovation.

It seems a bizarre reach, and perhaps even a non-sequitur, to reference Malthusian theory in a discussion of the “golden age” of mineral collecting. However, the parallels with “peak oil” predictions and the demise of the modern mineral production of truly fine specimens are surprising. Since 1980 the number of significant mineral specimens discoveries is extraordinary; Bunker Hill pyromorphite, Sweet Home rhodochrosite, Red Cloud wulfenite, Milpillas azurite (and other secondary copper minerals), Fresnillo stephanite, Merelan tanzanite and the incredible gemstone minerals from Pakistan along with the  flood of minerals from China.  Never before has the quantity of high quality minerals been remotely like it is today.

aquamarine.paki

Aquamarine from Pakistan recovered in the last 10 years – the quality is unrivaled in history.

There are many reasons why Malthusian thinking has failed in predicting the dynamics of the mineral collecting hobby, but mostly it is a change in what economists call the demand relationship.  Although there has always been a supply-demand relationship in mineral collecting, the foundations for that relationship changed as high-end mineral specimens became “works of art”. University of Chicago economist David Galenson likes to use the career arc of impressionist Paul Cézanne as an exemplar for the art market.  In 1895 Cézanne had his first one-man show in Paris, and sold a single painting for 400 francs.  A painting that did not sell in this show was later bought in 1899 for 4,400 francs – a tenfold increase in 4 years! In 1913 a Cézanne work sold for 25,000 francs, and in 1925 a painting was sold in auction for 528,000 francs.  What changed in those 30 years?  Certainly not Cézanne — he died in 1906. Some might argue that Cézanne’s work was simply unappreciated when first viewed, but a more nuanced analysis suggests that a very small number of art collectors were influenced by an even smaller number of art dealers to view the painter’s work as an absolute essential “to have”.  Passion – probably influenced by dealer manipulation – drove fierce competition.

The mineral collecting hobby now has the same drivers as fine art. There are many rumors of individual mineral specimens that sell for several million dollars; “I could have bought that azurite for 100 dollars 10 years ago”  it has become an old saw for long-time collectors.  There is a community longing for years past when a collector of modest means could build a fabulous ensemble of minerals.  There is a malaise that a “golden age” has passed, and mineral collecting is in a death spiral. However, the very fact that there is a “minerals are art” market is probably why there are more how quality specimens than ever for sale.  This truly is the golden age of mineral collecting.

OldschoolTGMS

The Tucson Gem and Mineral Show began in 1955, and help span a “golden age” of mineral collecting that orbited around mineral clubs and annual shows. The TGMS show was in the quonset hut pictured above between 1955-1971. Humble beginning for a show that now has special exhibits and displays that are valued at 100 million dollars or more.

The First Golden Age: The Rock Hounding 50s and 60s

Mineral collecting – as a hobby, profession, scientific endeavor – has been around for at least 500 years.  Wendell Wilson wrote a fabulous tome on the origins of collecting, The History of Mineral Collecting, 1530-1799 in 1994.  “Collecting” coincided with the rise of science applied to mining, and Georgics Agricola’s De Natura Fossilium published in 1546 is considered the first modern textbook of mineralogy.  Although there are some exceptions, the first 350 years of mineral collecting was dominated by the gentleman naturalist, and specimen quality was not as important as documenting topographic mineralogy. By the end of the 19th century there were scores of serious mineral collectors in the US (and even more in Europe) – mostly rich business men — and minerals dealers became a real profession.  However, in the US the most important event in the later half of the 19th century that changed mineral collecting was the rise of high education. Hundreds of universities and colleges sprung up across the nation, and geology was taught in nearly all; remarkably, all these new colleges sought to acquire geology collections, including minerals.  In response to demand, companies like Ward’s (Ward’s Natural Science was founded in 1862 by Henry A. Ward) mass marketed minerals, and the “common man” could own specimens from around the world.  This spawned mineral clubs – The New York  Mineralogical Club was founded in 1886, the Philadelphia Mineralogical Society in 1892, and by 1900 there were at least 2 dozen amateur groups promoting mineralogy. These societies had a tremendous impact on a generation of scientists; one of my favorite stories is the connection between Linus Pauling and J. Robert Oppenheimer (all stories come back to Los Alamos…..) – they were both mineral collectors! In fact, Oppenheimer gave a several hundred specimens to Pauling when he was at Caltech, and in turn, Pauling gave many of these to his son-in-law, Barclay Kamb, who later became the head of the Earth and Planetary Sciences department  at Caltech (he was the department head when  I was a student there in the 1970s).

quartz-1

Quartz crystals originally in the Oppenheimer Collection that were given to Luis Pauling. Photograph by Anna Wilsey.

By the late 1930s there were at least 120 clubs in the US, and “rock hounding” was a popular past time. However, it was with the end of World War II that saw an explosion in rock hounding; the hobby literally swept across the country, and by 1947 there were at least a thousand clubs. The American Federation of Mineralogical Societies (AMFS) was founded in 1947, and club gem and mineral shows became common place.  One of the most influential of these clubs was the Tucson Gem and Mineral Society (TGMS) which was founded in 1946. Tucson was an international center for mineral exploration, and the University of Arizona had strong academic programs in economic geology and mining engineering.  There were more than a 1000 mines – active or abandon – within 100 miles of Tucson, and this was a collectors paradise (anecdotally, when I graduated from Caltech I chose to take a position at the University of Arizona based on this “center of the mineral universe” – it certainly was not the center of theoretical and computational geophysics).  In 1955 TGMS launched its annual show (nine dealers, but more than 1500 attendees!).  Soon the TGMS show aggressively moved to the national stage – and attracted exhibits from museums like the Smithsonian Institution – and by the mid-1960s was attracting an international cliental. The 1970 were halcyon days for mineral collecting – thousands of colorful minerals were pouring out of Mexico, and the TGMS show was a perfect market place.  This is what most collectors think of as the “golden age”.  One of the factors that contributes to the nostalgia was the modest prices charged for minerals – it was a mom and pop enterprise catering to a broad spectrum of collectors.

desertinn

The TGMS show changed the mineral collecting hobby – it became big business. Satellite shows proliferated, including the hotel room collection of dealers that set up at the Desert Inn. This was the front end to the transformation of mineral collecting as a populist hobby to high art.

The dramatic growth the mineral collecting enterprise naturally became stratified.  The “best” minerals, especially those that were colorful, became much more expensive.  In addition, the concept of a market for minerals that paralleled the market for art pushed this segregation even further.  By the late 1970s there were mineral dealers in the TGMS show that only “dealt” with high end material; these dealers would sell individual specimens for more money that most of the mom and pop dealers would make during the entire TGMS show. It was the Malthusian end – demand crushed the supply side of the equation.  Further, it seemed advances in mechanized mining, solution extraction, and exploration of low grade ores meant that the flow of collectable minerals was slowing to a trickle.

Much grumbling was heard in the late 1970s that the mineral collecting hobby was “over”.  Purchasing high quality specimens was becoming out of reach for many collectors, and large number of the collecting localities in the US were being reclaimed or closed to the causal rock hound.  However, the very driver that caused this grumbling – money – was allowing collecting to be done on a commercial scale.  Collecting contracts were profitable in some large active mines, and the potential to realize profits began to entice wealthy collectors to invest in specialty mining: the Sweet Home Mine rhodochrosite and Red Cloud wulfenite mining endeavors would not have happened without a market for million dollar rocks.  In the mid-1990s dealers began to market on the internet – it was an innovative way to reach remote customers, but it also had the remarkable effect of democratizing the pricing of minerals.  Miners in Bolivia could actually see how much a dealer in the US was asking for the vivianite specimen the miner had sold to the dealer a month ago. A new supply-demand relationship in mineral collecting was born.

ccccc

Silver in friable quartz, Andaychagua Mine, Peru (photograph by Jeff Scovil). The specimen is 5.2 cm tall, and shows a plate of spinel twins; mined in May, 2015.

Today’s Golden Age – At Least for Silver Minerals

There is no question that the mineral collecting hobby in 2016 is very different than it was in the 1970s.  However, the quality of minerals being bought and sold today is higher than ever.  The market model is excluding young collectors, and restricting collectors of modest means (I often hear about “bargains” to be found for the modest collector – however, when every display at a mineral show is filled with specimens that costs thousands of dollars, the collector of modest means is psychologically disposed to simply walk away). But, for collectors that can afford to invest, the minerals that are available today are exceptional.  This is especially true for colorful or gem minerals – but is also true for the “ugly” dark minerals, like silver minerals!
An exemplar for this new golden age are a few personal additions to my collection in the last 24 months – all specimens that were mined or recovered during in past few years.  I am a collector of modest means, but I have also been collecting minerals for nearly 55 years.  That long tenure means that I have many more avenues to acquiring minerals that beginners, or even most collectors, have at their disposal.  These examples are not “trophies”, but are still among the best known for the species.
During the summer of 2015 a few dozen acanthite specimens with specular luster were recovered along the Veta Madre of Guanajuato.  The Guanajuato mines are arguably the most famous silver locality in the world, and certainly the source of the  “best” classic acanthites — strings of stacked pseudo cubes.  This recent find is different, but still spectacular, from the classics.
383.acanthite.guanajuato

Complex cluster of acanthite crystals, 3.2 cm high from the Mina La Cata, Guanajuato, GTO, Mexico (Jeff Scovil, photograph).

Guanajuato is located 475 km northwest of Mexico City, along the “silver channel” a string of incredible silver districts running along the spine of Mexico. In 1548, a group of ore haulers was returning to the recently discovered silver camp of Zacatecas after delivering their load to Mexico City. The haulers decided to camp beneath a rock outcrop that resembled a frog – the name Guanajuato is said to be a Spanish pronunciation of the Tarascan Indian word for hill of frogs (Martin, 1906).  A little prospecting uncovered a vein of silver, and a claim was staked on one of the world’s greatest mining camps. Over then next 475 years Guanajuato would go through periods of boom and bust; the booms were extraordinary! In the 18th century Guanajuato accounted for two thirds of the world’s total silver production. In 1906, Englishman Percy Martin wrote a promotional book call Mexico’s Treasure House (Guanajuato), in which he extolled the virtues of the silver district: “The silver mines of Guanajuato differ from most other mines in the world inasmuch as there is nothing conjectural nor problematic about them”. Hardly true, but there is nothing conjectural about the fact that for 450 years the district has supplied unsurpassed mineral specimens.

GuanajuatoMap

Basic geologic map of Guanajuato from Wendke, 1965. The Mina La Cata is located between the Valencia and Mellado.

During the summer of 2014, and again in the spring of 2015, very fine spinel twinned silvers were found at the Andaychagua Mine, in the San Cristobal District of Peru.  The San Cristobal District has long been known for silver minerals, but the new find are the best herring bone silvers to be mined since the Batopilas, Mexico silvers recovered in the 1980s.

387.silver.peru

Multiple plates of spinel twinned silver from the Andaychagua Mine Peru. The specimen is nine cm tall. Jeff Scovil photograph.

The San Cristobal District is located in the Cordillera Occidental about 120 km east of Peru and the first mines in this region were recorded in the 16th century.  The region has a rich history of producing silver-bearing mineral specimens and some fine spinel twins of native silver (from the San Cristobal Mine) in a crumbly siderite matrix were on the market in the mid-1980s.  The Andaychagua mine is one of four (the other three being the San Cristobal, Ticlio and Carahuacra) in the district that are active, and is presently owned by Volcan Compañía Minera S.A. (acquired in 1997). The annual silver production from the district is about 250,000 kg – however, specimens for collectors have been rare for the last 20 years.

perusilver

Location of the major mining districts in Peru. San Cristobal is a mountainous district with an average elevation of approximately 14,500′ (map from Bartlet, 1984).

The Machacamarca District, also known as the Colavi District, is located in the Bolivian tin belt, a chain of related mineral deposits that extends nearly 1000 km north-to-south along the eastern Cordillera of Bolivia.  The northern part of the belt is marked by Suko, and the southern end is Pirquitas in Argentina. The world’s most famous silver deposit – Cerro Rico in Potosi – sits in the middle of the tin belt. Colavi is only a few 10s km north of Cerro Rico – but those few km are across the most rugged  mountainous terrain in the world.

tindeposits

The mine of the Bolivian Tin Belt. In the center is Potosi, home of Cerro Rico. Machacamarca, Colavi is located due north of Potosi.

In April of 2015 a significant find of freibergite crystals were recovered from an obscure mine identified as the Melgarejo Mine. Numerous geologists that work in the area scoff at the locality – they don’t doubt Colavi, but have never heard of nor seen the Melgarejo Mine.  Mariano Melgarejo is a Bolivian  historical figure of some considerable ill repute – he give a significant portion of eastern Bolivia to Brazil in the Treaty of Ayacucho in exchange for a magnificent white horse, and in 1870 ordered his troops to march to Paris to protect France from an invading Germany.  Nevertheless, the freibergite crystals are certainly the largest ever found.  It is difficult to tell the difference between friebergite and tetrahedrite (that carries some amount of silver), and many specimens labeled freibergite turn out to be the much more common tetrahedrite.  The specimen shown below is the one of the very best found, and I personally checked the structure to confirm its identification.  Considering that freibergite has been identified from hundreds of localities since the late 18th century, the fact that “world’s best” now appear is remarkable.

386.friebergite.bolivia

Freibergite crystals, 7.2 cm across (Jeff Scovil photograph). The reputed locality is the Melgarejo Mine, Machacamarca, Colvai, Bolivia. “Reputed” because some have questioned whether the actual locality was obscured to preserve a source.

The Imiter deposit is located in the Anti-Atlas Mountains, Morocco, northern Africa, and it is one of the largest silver deposits in the world.  Imiter has been producing wonderful collectable specimens for several decades; these include octahedral acanthites, dyscrasites, various silver-mercury amalgams, some of the world’s best xanthoconite, and is the type locality for imiterite. Proustite is well known from the mine, but most of the crystals have been small.  The specimen below is a large cauliflower like clump of crystals (the specimen weighs just under 3 pounds!) with individual crystals that are up to a cm across and several cm tall. It is impossible to know for sure when this specimen was recovered – it is clear that it was smuggled out of the mine, and passed through local merchants before coming to the US in late 2014.

Morocco.proustite

13 cm cluster of proustite crystals from Imiter, Morocco (Jeff Scovil photograph). This small cabinet sized specimen is solid proustite, and contains individual crystals to 1.8 cm on a side. The luster, and deep vermillion color, and overall size make this a modern “classic”.

Although this is hardly a “classic” proustite as compared to a sharp dog’s tooth from Charnarcillo or individual cherry red crystal from Schneeberg, it is an amazing specimen.    The Imiter Mine had a capacity of 300,000 metric tons per year (t/yr) of ore and surely will continue to produce interesting specimens.

imiter.map

Metal mines of the Anti Atlas mountains in Morocco. Imiter is one of the largest silver mines in the world, and is a large open pit.

When will the Golden Age Wane?

Malthusian theory would predict that demand will outstrip supply in the future – maybe the near future. But mineral collecting is not dead, and in fact there is as much evidence based on the last 30 years that there will even more high quality specimens exchanging hands for decades to come.  Why is Malthusian theory is wrong?  Because demand for minerals – both as a commodity and as a collectable – is higher than it has ever been, and the world is responding. More mines, more mining, and more money in minerals.

silverproduction

Global silver production – looks just like the global growth in population! Each and every mine has the potential for specimens and even though historic localities are exhausted, new horizons are bright.

It is certain that the market of “art” will be what mineral collectors will have to deal with in the next quarter century.  If history of the art markets are predictors for minerals, there will be periods of malaise; but even during these periods the assessed worth of classics had an average annual escalation of several percent.  This leads to another question – where the heck do all these wealthy people come from?  Again, there are detailed studies of the art market, and one of the alarming (alarming if you are a collector, perhaps enticing if you are a dealer) lessons learned is that globalization will dramatically increase competition at the highest end.  However will mineral collecting evolve with a very stratified market?  That experiment is being played out in real time, and I hope for “niche markets” to develop – but that has not happened yet.  Hold on to your wallets, the golden age squeezes…….


The Glue Does Not Show: Mineral restoration and specimen value

Shades of grey wherever I go
The more I find out the less that I know
Black and white is how it should be
But shades of grey are the colors I see

Billy Joel, Shades of Grey, released 1993.

polybasite1

Stephanite, Husky Mine, Mayo Mining District, Yukon Territory, Canada. The crystal group is approximately 6.3 cm across, and outstanding for the locality; Husky Mine polybasite and stephanites typically have an iridescence that it probably caused by light reflection/refraction in a very thin coating of an unknown silicate. Jeff Scovil Photo.

In the mid 1980s I was first asked to be a judge of the competitive mineral exhibits at the Tucson Gem and Mineral Show. At that time the TGMS competition, and its two top awards – the McDole Trophy (best case of minerals entered into competition) and the Lidstrom Trophy (best individual mineral entered into competition) – were considered the pinnacle of the mineral world. The winners of these awards looked like a “Who’s Who” of the mineral collecting community, and every year the competition was passionate and savage. The rules for the McDole and Lidstrom awards were few; it was based on the judges experiences, biases, and an element of luck on who decided to enter the competition. The judging for the McDole and Lidstrom awards was also a “discussion” rather than some type of formal poll — a judge with a domineering personality could filibuster the other judges into accepting his or her opinion.  I recall clearly the discussion around a particular specimen entered into the Lidstrom competition that I was fond of;  “We can’t possibly consider that specimen a best – it has been repaired!”  The pronouncement carried such an air of academic certitude that I immediately agreed.  Of course, it had been repaired!  How could it really be a great mineral specimen if there was some glue involved!

It was not too long after that I began to ponder the absurdity of dismissing anything that is repaired as inherently flawed (on a personal note, now that I have multiple metal parts in various joints, I embrace the repaired).  Repairing a mineral is rather common – mineral extraction is inherently a violent activity, and the very act of handling a specimen introduces the possibility of drops, dings and scratches. But there is still a feeling that repairs should affect the monetary value of a specimen. I don’t think I have ever been to mineral show where I have not heard some version of the conversation between a dealer and a collector where the potential purchaser doesn’t ask for a significant discount because the specimen has been repaired.  The stephanite pictured at the top of this article is a fantastic complex crystal from the Husky Mine in the Yukon Territory, Canada.  I first committed to buying this piece for my collection around the year 2000.  However, when I went to go pick it up from the dealer I opened the box and the marvelous sample of “brittle silver” was in three pieces!  The stress of transport had caused the crystal to part along inter-growth boundaries.  I was heart broken, and walked away from a masterpiece.  The dealer repaired the piece expertly, and eventually I was able to acquire it.  However, several years later I was transporting it to be photographed and it “parted” again!  Fortunately, it was once again restored, and now sits permanently in my mineral cabinet never to travel again.  I believe it is the best, or one of the best, Husky Mine stephanites in existence, and the fact that it has some clear cyanoacrylate helping to hold it together is inconsequential.

Repair would, thus, seem to be a rather “black and white” issue – restoring a collectable to its original configuration is not fraud or even misrepresentation of nature. Sadly, it is not “black and white”, and repair/restoration has become a spectrum disorder in the mineral collecting world.  Today many consider filling missing gaps in crystals with acrylic resin, buffing away scratches on crystal faces or even heating a specimen to “restore” its primordial color as simply “sophisticated repair”.  Not black and white, but shades of grey.

1pieta1

The Pieta, carved by Michelangelo in the 16th century. The statue has been repaired a number of times in the last 500 years — most recently removing the damage done by a geology hammer (!) wielded by a lunatic.

Real Repairs

The Pieta is a signature masterwork of Italian sculptor Michelangelo, and one of the most famous works of art in history. Michelangelo was only 23 years old when he carved the single block of Carrara marble into a haunting image of a crucified Jesus being held by his mother. By any figure of merit, the Pieta is priceless. Yet, it is repaired – several times! The four fingers of Mary’s left hand were snapped off during a move in the 18th century (restored in 1736).  The most egregious damage occurred in an instant of insanity when Laszio Toth, an unemployed Hungarian geologist attacked. Toth struck the Pieta more than a dozen times with his field hammer, breaking off Mary’s arm, part of her nose, and chipping her face.

michelangelo-pieta-vandalism-attack-4

Mary’s hand after the Toth attack. More than a hundred fragments of marble had to be reassembled to restore the Pieta.

The repair of the statue was done by a team of 10 people painstakingly reassembling the fragments and filling in voids with a mixture of powdered marble and polyester resin.  When the restore work was unveiled it was claimed that it was impossible to identify where the damage had been.  Some experts suggest that with the passage of time the resin has perceptibly changed color, but in general the repair has faded into history and the magnificence of the Pieta has been restored.

The restoration of the Pieta might be a fanciful stretch as an analogy for mineral repair, but it does frame the philosophy of specimen “value”.  It is highly unlikely that the reconstruction of Mary’s left hand would effect the value of the Pieta if the Vatican decided to part with the treasure;  I can’t imagine any art collector asking the Vatican for a “discount” because the marble was not exactly as Michelangelo carved it long ago.  On the other hand, the restoration process went to great lengths to assure that nothing changed from the original – no added expression to Mary’s face, no extra lamb seated at her feet.

Almaqueen.3

The Alma Queen; a 10 cm, complex rhomb of rhodochrosite perched in a matrix of fine quartz crystals.  This “rock” was found in 1966 at the Sweet Home MIne, and has been called the finest mineral specimen in the world.

The Rhodochrosite Royalty – a family full of plastic surgery

In 1966, a 90 year old silver mine located on the slopes of Mt Bross – one of Colorado’s 53 peaks that have elevations in excess of 14,000 feet above sea level – yielded a remarkable mineral specimen.  The mine was called the Sweet Home, and during its on-again, off-again mining history had periodically produced some of the world’s best rhodochrosite.  However, the standard for rhodochrosite was reset when a mining crew drilled into a pocket and found a 10 cm rhombohedron of cherry red rhodochrosite perched on a slab of pencil thin white quartz. The specimen was purchased by one of Colorado’s earliest fine mineral dealerships, Crystal Gallery, for the princely sum of $2500.  Crystal Gallery was a partnership between Merle Reid and Colorado collector legend George Robertson.  The rhodochrosite ended up in the hands of Peter Bancroft (much to the chagrin of George Robertson), who christen the piece as the “Alma Queen”, in recognition of the mining town a few miles southeast of the Sweet Home Mine (the picture above is “official” photo of the Alma Queen from its present home, the Houston Museum of Natural Science).  In short order the Queen passed through a hands of a number of famous mineral dealers, finally becoming a prized possession of Perkins Sams.  In 1986, Sams sold the Queen to Houston Museum – and a few years later it was being moved and was broken!  Actually, it was not too surprising given that the rhodochrosite has perfect cleavage, and the huge crystal was isolated and perched on matrix.  Fortunately, the crystal was “repaired” – it is impossible to see the glue reattaching the rhomb – and is still considered a masterpiece.

The Alma Queen enticed others to want to return to the Sweet Home Mine and search for more rhodochrosite. In 1991 Bryan Lees and partners began a professional and systematic exploration for mineral specimens.  In 1992 Lees’ operation discovered a 1.5 meter long pocket that yielded incredible — larger than even the Alma Queen — specimens.  Most of the crystals were detached from matrix, jarred from their natural perches by the mining activity.  The largest of the crystals was more than 15 cm across, and was dubbed the Alma King.

rhodoinplace

Bryan Lees holding the Alma King, just outside the Rainbow Pocket.  The crystal was some 15 cm across!

The Alma King was eventually reattached to matrix, and was brought to the Tucson Gem and Mineral Show in 1993.  I remember seeing the specimen, and was stunned.  I also recall standing next to a old time collector who remarked “too bad it is repaired”.  Wow – my thoughts were not conflicted at all – the repair was sincere and returned a natural masterpiece to it’s rightful magnificence.  It was exactly like the restoration of the Pieta!

almaking.2

The Alma King – repaired. The specimen now sits in the Denver Museum of Natural History.

There is little argument that the repair of the Sweet Home rhodochrosites was the right course of action, and certainly did not diminish the value of the specimens.  However, it also coincided with the crest of a darker tsunami in the collecting hobby that demanded specimen perfection, and art aesthetics overtaking  all other metrics of mineral specimen evaluation.  A significant percentage of the Sweet Home specimens required repair, although the evolving euphemism was “specimen preparation”; a dialog developed around the theme of “returning the specimen to the condition it was in nature”.  This catch phrase has become the a divide between collectors;  those that prize the art of mineral specimens are willing to see flaws removed by polish and resins, while other collectors recoil at any man-induced enhancements and celebrate only that which can be documented “as found”.  This gulf is wide, and brings cries of “fake and fraud” from collectors in the later group when they view many of the world’s best mineral specimens. However, this group of collectors – the old school – is dying away.  Not yet irrelevant, but mostly marginalized.  I am old school.

MRcover

The cover of the Mineralogical Record, January 2015. On the cover is one of the most amazing tourmaline specimens in existence, and the volume is full of information on the Pederneira mine. What is missing is the painstaking history of specimen repair and restoration – much work is done with added materials.

When a grey line becomes red — and crossed

In the last 50 years the mineral collecting hobby has seen dramatic changes – or perhaps evolution.  What was once the realm of rockhounds is now a glided age of art.  One of the most obvious symptoms of this change is what collectors accept and expect in a mineral specimen.  Repair and restoration have always been important for mineral specimens; however, the definition of repair and restore has changed as prices have escalated.  There has always been a desire to make specimens attractive, but today it is expected that many  specimens are oiled, waxed or sprayed with silicon to enhance their luster and hide their imperfections.  Use of these cosmetic trappings was once a “red line” for collectors – absolutely rejected.  But just like US foreign policy on the use of chemical weapons, that red line was faded to grey.  A tour through the many hotel rooms of the “high end” mineral dealers participating in the 2015 Westward Look Fine Mineral Show in Tucson (February 6-8) reinforces this dramatic shift;  it is fair to say that most expensive fluorite specimens for sale have been treated with oil, every recent amazonite dug from the pegmatites in the high peaks of Colorado has been “juiced” to enhance the luster, and most gem-quality garnets are getting at least a spray of enhancement.  And, further, casual conversation with collectors seems to reinforce that this is what they want.  Perfection is essential for a work of art.

Emerald_Treatment_Before_After

A comparison of “before and after” for a cut emerald. The cut stone on the left is natural, and on the right has been treated with cedar oil (from http://www.jfjco.com/2014/05/18/emerald-treatments/)

The desire to “improve” minerals is a couple of thousand years old.  There is written accounts of Greeks using cedar oil on emeralds to enhance the color.  The purpose of the oil was to fill the flaws and cracks with a material (the oil) such that when light is shined on the crystal there would not be reflections from the imperfections.  The cedar oil had approximately the right index of refraction (about the same as the emerald itself), and low enough viscosity (when heated) to flow into the tiny cracks, but high enough such that it would remain (at least for a while) after treatment.  Today the oil is mixed with a polymer which “fixes” the oil.  There are about a half dozen “restoration” labs in the US that work on minerals, and most have proprietary processes to do essentially the same thing as the cedar oil treatment except for fluorite, sphalerite, garnet, etc.  The science behind these processes is fairly sophisticated — but the treatment is rarely disclosed.

rowingincircles

Classic Gary Larson cartoon – Rowing in Circles. This reminds me of specimen restoration – dealers on one side, collectors on the other. Dealers provide what collectors want, and collectors hear from dealers what specimen perfection should be. It is just rowing in circles.

Today it is hard to “lay blame” for the practice of mineral restoration that relies on removing perceived imperfections at the doorstep of dealers.  The nature of the “trophy collector” is to find perfection – and that sense of perfection does not have to be the hand that nature dealt.  Further, it is clear that repair and restoration no longer decrease specimen value, but actually increase value.  As Sir Walter Scott opined: Oh what a tangled web we weave, When first we practice to deceive.

Old School with a New World Order

I love collecting minerals – it is something that I have done with passion for more than 50 years.  I have changed along the way, and the hobby has changed even more than I.  I am deeply disturbed by many of the changes, but that does not make them “wrong”. Just as I am aghast at at what I perceive as the personal values of generations other than mine, my sense of why I collect, and what a mineral specimen means to me, does not have to be shared with others.  The Dalai Lama says: “Happiness is not something ready made. It comes from your own actions.”  I don’t need to change what and how I collect.  It is the science and human story that are codified and crystallized in my minerals. That is why I happily collect that which is repaired and total reject oils and waxes.  A red line.

Ice in the Mountains: Gravity, Glaciers and Garibaldi

Everything is flowing — going somewhere, animals and so-called lifeless rocks as well as water. Thus the snow flows fast or slow in grand beauty-making glaciers and avalanches; the air in majestic floods carrying minerals, plant leaves, seeds, spores, with streams of music and fragrance; water streams carrying rocks – John Muir

mountgaribaldi

Mount Garibaldi from Squamish Chief

The Coastal Range in southwestern British Columbia is a land of spectacular mountains, and home to the southernmost icefields in North America.  The rapid rise of the mountains from the inland passage between Vancouver and Victoria Island, along with prevailing winds bringing marine moisture from the Pacific means that there is ideal conditions to foster alpine glaciers.  We visited Whistler (of 2010 Winter Olympics’ fame) with the hope of visiting some of the glaciers before they disappear — yes, although there are many alpine glaciers, they are in rapid retreat probably due to increasing atmospheric temperatures.  To be sure, ice is every where, but a simple comparison of photographs from the early part of the 20th century to the scenes today shows that the ice is disappearing.

Image

The Garibaldi Ranges

Whistler is located in a broad mountainous zone, known as the Coast Range, which extends from Southwestern Yukon along the entire coast of British Columbia (1600 km long, average 300 km in width). There are numerous subdivision of the Coast Range, and the southern most extreme is called the Garibaldi Ranges. Whistler sits in the middle of the Garibaldi Ranges,  and the high point is Wedge Mountain (elevation 2892 m) which is just north of Whistler.

wedgemont1Wedge Mountain viewed from Wedgemount Lake – to the left of the peak is Wedge Glacier

The geology of the Garibaldi is complex, and it has taken geologists decades to unravel the imprints of ancient subduction, plate fragment accumulation, and volcanism to develop the history of these mountains. The Coast Range was built in response to the complex interactions between the North American Plate and various smaller plates, most of which have now disappeared.  About 130 million years before the present an oceanic plate named the Insular Plate was subducting beneath North America – along the western margin of the Insular Plate another oceanic plate was subducting beneath Insular called the Farallon Plate. Farallon-Insular subduction zone built a volcanic island arc on the Insular plate (the modern day analog to Farallon-Insular-North America is the Phillippine Mobile Belt).  The relative plate motions between these three plates meant that the Insular Plate was doomed to demise – the relative motion of North America was to the west, and Farallon to the east, shrinking and squeezing Insular until it ceased to exist 115 million years before present. The Insular Island arc was “accreted” to the North America Plate forming the Insular Belt of folded and metamorphosed rocks “glued” to North America by a large granitic batholith.  Once the Insular plate disappeared the Farallon was now subducting beneath North America, and a Continental arc (not unlike the coast of Washington and Oregon today) formed and was populated with large stratavolcanoes.  The mountainous zone associated with the arc was known as the Coast Range Arc, and was active from approximately 100-85 mybp.  About 85 mya the Farallon plate broke into fragments, and the northern section which was subducting beneath modern day BC became the Kula Plate.

squamishchief

Squamish Chief – a 2000′ dome of granite formed as the Kula Plate began interacting with North America

For the next 30 million years there was a massive influx of granites and formed one of the largest granitic bodies in North America and are now exposed in the Coast Ranges. The Kula plate eventually developed a relative motion that shut down the subduction beneath BC, and began subducting beneath southwestern Yukon and Alaska by 50 mybp. This shut down most of the volcanism within the Coast Ranges, although some stratavolcanoes like Mount Garibaldi remained active until more recent times.

Kochetal2009

The ice of the Garibaldi Ranges

Alpine Glaciers and Ice fields

Glaciers are defined as bodies of persistent ice with surface areas exceeding about ½ of a square km.  In general glaciers grow and shrink, and this is promoted by the flow of ice;  snow falls on part of the glacier and is compressed into crystalline ice which creates a gravitational stress “forcing” the surrounding ice to flow downhill. The ice at the leading edge of the flow eventually melts, either through encountering higher ambient temperatures in the atmosphere or the warm (above freezing) waters of the ocean.  A special category of glaciers are called Alpine Glaciers, which form near the crest of Mountains, and are feed by the seasonal fall of snow and melting at the lower reaches to the mountain, particularly in the summer.  The area that a alpine glacier adds ices is called the neve, and typically is a bowl shaped region which is called a cirque.

tantalusicefallA large alpine glacier in the Tantalus Range next to the Garibaldi Ranges. The large “head” of the glacier is known as the neve

Glacier motion is controlled by two things:  the strength of the ice, and the stress applied to the ice.  The crystal structure of all ice occurring in the natural environment is hexagonal – all snow and ice on Earth forms in a six-fold symmetry that typically forms sheets lying on top of one and another.  The figure below shows a typical arrangement of these sheets;  the red ball-and-stick figures are the oxygen atoms and the bonds to the 2 hydrogens in a water molecule.  The bonding between the sheets is weak, and under horizontal stress the sheets “slide” past one and another.  For small bodies of ice the stress loads introduce by gravity are modest and the ice deforms mostly as an elastic material.  However, when ice exceeds a thickness of about 100 feet it begins to deform plastically, meaning that it flows.  The flow is characterized by the Glen-Nye law that relates flow (strain rate) to stress (the weight of the ice) and temperature.  The flow of ice in a glacier is typically lowest along the base because of frictional resistance with the underlying rock.  Occasionally, glaciers also move by a process known as basal sliding where the glacier is lubricated by melt water (and making the frictional resistance disappear).

ice.structure

Massive ice forms sheets that are weak and flow when subjected to shearing stresses

The fate of a glacier is controlled by mass balance; ice is added to the top of an alpine glacier and ice is removed by melting at the toe or sublimation to the atmosphere (the removal of ice is called ablation).  There are many factors that can upset the mass balance, including temperature, rate of precipitation, and sudden movement that breaks apart the glacier.  The temperature effect appears obvious – if the glacier interacts with a warmer atmosphere less ice is formed.  However, this is actually a complex interaction and sunlight subliming the ice can increase during cool but clear conditions.  The precipitation is more straightforward; no moisture, no ice formation. All glaciers in the mountains of British Columbia are in retreat, meaning that the toe of the glacier is melting faster than new ice is arriving from the neve.  This phenomena is of alpine glacier retreat is well documented globally for mid-latitudes.  There are fairly good observational records for the shape of glaciers for many areas stretching back a couple of hundred years.  Francois Matthes noted that global temperatures where abnormally cool from about 1350 to 1850, and he called this the Little Ice Age (LIA).  Most early observations of alpine glaciers occurred during the LIA; after 1850 when the global temperatures increased there was widespread glacial retreat. Around 1930 this retreat slowed, and for many regions glaciers actually grew until about 1980.  Since 1980 glacial retreat has become universal, and appears to correlate with the global mean temperature rise.

Warrenglacierkcoh

The picture above from Koch et al. (2009) shows the Warren Glacier (which is located within the Garibaldi Ranges) photographed three different times.  This glacier was in retreat with the end of the little ice age (comparing 1912 to 1929), but was episodic in growth/retreat until 1977.  Since that time the Warren Glacier has been in rapid retreat. Over that last 20 years it has retreated at and average rate of 20 m/yr.  Not all glaciers in the Garibaldi are retreating at the same dramatic rate, but all are retreating and thinning.  A linear projection (which is always a bad idea, but simple to do!) suggests that 90 percent of the Garibaldi Ranges glaciers will disappear by 2035.

Enjoy the ice and marvel at its power while it lasts

Alpine glaciers are a truly beautiful feature of high mountains.  The ice also strongly shapes and carves the bedrock leaving both sharp and rounded structures that define the peaks.  It is rather remarkable that ice could have such at profound erosional signature considering the softness of ice.  However, like sandpaper glued with tiny corundum fragments, glacial ice lifts loose rock and freezes the into place along the base of the glacier.  As the glacier moves downhill the rock fragments cause abrasion and “polish” the underlying bedrock.  The abrasion produces “rock flour” that eventually flows away in the glacial melt.  The rock flour is what causes glacial melt water to be various shades of milky green.

wedgemontlakeWedgemount Lake is colored green by the rock flour from the Wedge Glacier

All of these glacial process, along with the ice, are most likely to be gone before 2050.  This will mean that we have different mountains, different vistas, and different impacts.  The nature of global warming is such that the die is cast — nothing is going to reverse the temperature increases in the next 100 year.  This means that it is imperative to visit these nobel mountain architects now, and appreciate their geologic legacy.

Cahokia: Geology and the Birth and Death of Cities

Civilization exits by geological consent, subject to change without notice.  Will Durant (American Philosopher)

ruins2b063

The American Bottom is a broad lowland directly east of St. Louis, Missouri along the eastern shore of the Mississippi River.   The area is about 175 square miles, and is a 10-mile wide floodplain of one of the largest confluences of rivers in North America.  Throughout the American Bottom there are abandoned meanders of the Mississippi River, swamps, and bogs.  800 years ago it was also home to the largest pre-Columbian settlement north of present day Mexico City. This city is known as Cahokia Mounds today, and is thought to have reached a peak population in excess of 20,000 people at its height about 1250 AD.  Why did Cahokia rise as a great city, and why did it eventually fail (in fact, it had completely disappeared by the time Columbus landed in the Caribbean)?  The story is, of course, one of geology.

photo-14

Star shows the location of Cahokia and the American Bottoms

Visiting St. Louis for the 4th of July holiday always means I am looking for some elevation to hike – a quandary along the Mississippi embayment.  My son suggested that we go to Cahokia Mounds and walk the “hills” of the ancient city.  I knew little about the people of the Mississippian culture that occupied the American Bottom from 600 to 1400 AD, except that they used the vast river system of what is the modern Midwest for transportation and that they build ceremonial “mounds” or elevated earthworks.  Cahokia was a large urban center that grew to at least 4000 acres and had at least 20,000 inhabitants at its peak, and probably had governing influence over three times that number of people along the Mississippi River.  Today the Cahokia is a State Historic Site – a park that covers about 3.5 sq miles, and has 80 mounds.  The largest mound is called Monks Mound, a four tiered platform approximately 100 feet high covering 14 acres.

photo-11

Monks Mound from the south in the Grand Plaza

Monks Mound was built by hauling soil (which was rich in clay and organic materials) from bog quarries called “borrow pits”.  Coring of the Mound shows that it was constructed in several phases, each from different borrow pits.  It probably was assembled over a couple of hundred years, and its increasing height had to do with “elevating” the status of successive rulers.  The top of Monks Mound had a large building or cluster of buildings- most modern interpretations are that these were the residence of the Cahokia ruler and court. Monks Mound derives its name from a community of Trappist monks that briefly resided in the mounds at the beginning of the 19th century and were thought to planned to build an monastery on top of the mound (luckily, the monks moved on before executing their plan).

Monks Mound overlooked a large compound that contained ceremonial burials, a plaza (called the Grand Plaza), and storage facilities for foodstuffs.  The entire region was surrounded by a wooden stockade complete with look out towers.  Due west of Monks Mound is a curious circle of that is thought to have served the purpose of a sun calendar.  The circle had a number of wooden posts or pillars that appear to be aligned with shadows cast for a rising sun during the solstices and equinoxes.  The functional similarity to Stonehenge in England has led to the naming of this site as “Woodhenge”.

woodhenge

Why did Cahokia rise to become a major urban center?  The most obvious explanation is geography based – the American Bottom is an incredibly fertile valley and the nexus of three major rivers, which could serve as a transportation hub. Just north of American Bottom the Missouri and Illinois Rivers join the Mississippi. The Missouri River is the longest river in North America (over 2,300 miles in length) and drains the Rocky Mountains of Montana and Wyoming.  The Illinois River is much shorter (only 300 miles long) but claims a drainage basin of nearly 30,000 sq miles in Illinois and Indiana.  The Mississippi River drainage basin covers the area between the Missouri and the Illinois Rivers – combined, the three rivers drainage basins cover nearly a quarter of the United States.  The wide extent means that at least one of the rivers would flood on an annual basis, and would deposit sediment, renewed with nutrients in the American Bottom.

479px-Illinois_1718

The converge of three great rivers: Missouri, Illinois and the Mississpii

There is a theory of cities and urban centers based on their projection of power.  There are “consumer cities” and “producer cities”.  In this definition consumer cities are a center of government and military power – the classic example was Rome in the ancient world, and Washington DC today.  Goods flow to consumer cities, and presumably, culture flows to the countryside.  Producer cities, on the other hand, produce goods and commercial services and export these to derive their power and influence.  Often producer cities rise in importance, become consumer cities, and eventually collapse when they lose their political power.  Cahokia is probably an example of this producer-consumer-collapse cycle.  The early Cahokia inhabitants developed a strong agriculture base – including annual planting of corn.  The soil was rich enough to support the production of grains in excess of the immediate needs of the inhabitants; these grains (at least the corn) could be exported to surrounding regions in exchange for other goods.  Copper from Michigan, sea shells from Florida, and gemstones from Mexico have been found in Cahokia excavations.  The flow of wealth was facilitated by the strategic location of the city with respect to the rivers.  This flow of wealth, in turn, fostered the growth of a governing structure, and Cahokia eventually transformed to a consumer city, and political center.

photo-13

Michelle and David looking at the diorama of village life around Cahokia

It is clear from the archeology of Cahokia that structures associated with rituals were mostly built after 1100 AD;  by 1250, at the height of the cities power, the core of Cahokia was dominated by ritual structures – a signature of government.

The population of Cahokia began to decrease after 1250 AD, and by the beginning of the 16th century it was completely abandon.  Some archeological work suggests that the diet of inhabitants began to change after about 1250 – a decrease in the ratio of protein to carbohydrates, which suggests that game animals had been hunted to scarcity.  It is unlikely that a climatic condition like an extended drought had much impact on Cahokia because of the three great rivers, although flooding and consequent soil renewal may have become less frequent.  However, it is clear that the collapse of Cahokia was more rapid than its ascent.  There are no strong indications of the city being “sacked”, but other centers on the southern Mississippi River rose during the 15th and 16th Century suggesting either a political struggle for power, or simply filling of the void left by the Cahokia decline.  The most likely explanation is a combination of environmental factors – a half a millennia of farming had depleted the soil and hunting had diminished the game animals such that the weight of the government could not be supported.  Geology gave the city its birth, but in the end the resources were over taxed.

photo-9

The picture above is from Monks Mound looking across the Mississippi to St. Louis on July 5, 2013.  The atmosphere is pregnant with humidity, but the modern “Cahokia” is obvious.  St. Louis was founded in 1764 by a French trading company based on it strategic location of the nexus of Missouri and Mississippi rivers.  Today it is still a producer city – but how long that epoch will last remains to be seen.

The Mountains are on Fire

God has cared for these trees, saved them from drought, disease, avalanches, and a thousand tempests and floods. But he cannot save them from fools ― John Muir

Image

Smoke plume billowing above Pajarito Ski Hill (Tuesday evening, June 4; Steve Black photo)

On Friday (May 31) a downed power line started a wildfire in the west-central region of the Jemez Mountains near a deep drainage called Sulfur Creek on the western margin of Redondo Peak.  The fire burned uphill on the eastern side of the drainage rapidly, and was named the Thompson Ridge Fire (although not on Thompson Ridge).  The sight of smoke in the Jemez was visible in Los Alamos by 5 pm and the entire town held their breath, thinking “here we go again”.  By Saturday afternoon smoke from the plume began to collapse on Los Alamos, and the smell of burnt pine caused an even stronger visceral reaction triggering memories from June 2011 when the Las Conchas Fire swept around the town, led to a week-long evacuation, and charred more than 150,000 acres.  The question on many peoples’ minds is “why?”  It certainly seems that the entire Jemez is going to be soon burned, leaving a high elevation desert.  The 1996 Dome fire, the 2000 Cerro Grande and the 2011 Las Conchas Fires have changed the scenic vista of the eastern Jemez profoundly and probably for hundreds of years.  Each of these fire was bigger than the last:  The Dome fire was 16,500 acres, Cerro Grande was 48,000 acres, and Las Conchas was over 150,000 acres.  The obvious question is “are the fires getting bigger and more frequent?”

Image

The Jemez Mountains are a unique alpine island created by the Jemez Volcanic Complex (JVC) that was active for about 800,000 years beginning around 1.4 million years before the present.  The JVC lies along a line of volcanoes that arcs across New Mexico from the southwest to the northeast, known as the Jemez Lineament.  In the southwest the San Carlos Volcanic Field (in Arizona) anchors the Lineament, and it passes through Mt Taylor near Grants, the Jemez, and finally terminates in the Raton Volcanic Field.  There is no real good explanation for the Jemez Lineament, and geologists continue to debate both its cause and significance.  The JVC is the largest of the volcanic fields on the Lineament.  The geologic map above shows the Jemez Mountains.  The Jemez Mountains surround the Valles formed during the collapse of the JVC about 1.1 million years ago.  In the middle of the collapse crater a great “resurgent dome” was pushed up by the death throes of a great volcano.  This dome is Redondo Peak – which is not an eruptive volcanic cone, but an extruded dome.  Redondo Peak is the high point in the Jemez at 11,258 ft elevation.  The uniqueness of the Jemez was recognized by the first geologic expeditions of the west; John Wesley Powell himself visited the Jemez in the 1880s and described it as a giant volcanic field (anyone interested in the geology of the Jemez should read Fraser Goff’s book “Valles Caldera: A Geologic History”).

The volcanic field and Redondo rise above the surrounding New Mexico highlands to form a roughly circular mountain range.  This range has its own flora and fauna – or at least it did before the great fires of the last 25 years.  Elevations above about 7200 feet were dominated by ponderosa pine and various fir and spruce.  After a fire the pine is replaced by scrub oak and lower growing vegetation. Craig Allen has studied the fire history and vegetation of the Jemez, and has found dramatic change.

Image

This change is from both fire and mortality of the pine forest due to prolonged beetle attacks.  The figure above shows a color-coded map of the Pajarito Plateau, centered on Los Alamos, and where fire or beetles have affected our forests.  In twenty years 90% of the forest have been subject to stress.

The question of “why” is the Jemez burning can be partially answered by looking at the fire history of the mountains.  There are various ways to do this, including coring trees looking for scars from ancient fires, and looking at the peats in the meadows within the Valles and looking for preserved ash and charcoal layers.  When Allen and other researchers did this they reconstructed a fire record that stretches back nearly 10,000 years.  There are literally tens of thousands of fires over this period, and some strong trends are worth noting in the last couple of hundred years.

Image

The figure above shows the location of nearly 5000 fires in the 20th century, along with the Cerro Grande Fire.  The great bulk are small, local wildfires, probably almost always caused by lightning. There is evidence in the distant past of very large fires – probably as large as Las Conchas – all across the Jemez. There is a moderate correlation with those large fires and large-scale drought. However, before the mid-20th century wildfire was most commonly characterized by small, frequent fires.

Beginning in the late part of the 19th century man began to have a significant impact on the ecology of the Jemez.  Livestock grazing in the Jemez became “big business” and the removal of the understory grasses probably suppressed wildfire.  The cows and sheep ate the grasses that supported spreading the fires.

Image

In the 1930s the Jemez became a lumber supplier, and the region began to be heavily logged.  This is particularly true for Redondo Peak and the Valles Caldera which were in private hands, and were not subject to the regulation of the Forest Service.  The picture above shows a logging road from the mid-1930 on the northwestern side of Redondo.  Today, logging roads are still seen across the Jemez, especially as spirals up the various domes.  The lumber “boom” ended, and the forests began to fill in.  Livestock grazing dropped dramatically, and new Federal oversight of wildfire suppression caused the forest cover to densify.  By the 1960s the forests were much more dense then 200 years previous.  The pathways for fire were increasing.

Over the last 2000 years there have been periods of drought and high precipitation.  Around 1990 we entered a period of drought, and the window between 2000-2010 was likely the driest decade in a millennium.   This drought stressed the trees, and they became much more susceptible to disease.  In particular, the pine bark beetle attacked, and will eventually kill, more than 1.3 million acres of ponderosa pine in New Mexico and Northern Arizona in the period of 2002-04.  The beetle problem is complex – stressed trees are one issue, but also the density of the forest allows the beetles to spread much more rapidly than in the past.

Image

Nate McDowell and colleagues at Los Alamos produced the figure above that shows the loss of forest due to the beetles and fire.  It is fair to say we are in a long-term, profound, change of our forest.  The Jemez is not unique, but it does seem to be at the confluence of disease, drought, forest “management” and finally, the encroachment of man.  Before 1950 the vast majority of wildfire was caused by lightning.  However, since 1990 more than 85% of fires have a man-made fingerprint.  For the four major Jemez fires in the last 25 years it is all man-made;  The dome fire was caused by a camp fire, the Cerro Grande started as a controlled burn (what a total fiasco – and to this day an unpunished event), Las Conchas was started by a downed power line as was the present Thompson Ridge.

Image

Although it is dangerous to predict the fate of nature, it certainly seems that large fires are going to continue in the Jemez for years to come.  A break in the drought would help, but a short break would only promote the understory growth which would become the match stick once drought resumed.  We are standing on the cusp of a major change for our beloved Jemez, and can only hope that luck and nature conspire!